AMAZON multi-meters discounts AMAZON oscilloscope discounts
PART II THERMAL CONTROL
The next five Sections deal with solar geometry (below on this page), heat flow fundamentals, and climate control systems for a range of building types and sizes (small buildings, large buildings). The underlying design intent is the comfort of people, for whom we heat, ventilate, and cool buildings, and the provision of acceptable indoor air quality. Thermal comfort criteria are discussed in Section 4 and indoor air quality in Section 5.
----------------------------------
Section 6: Solar Geometry and Shading Devices
An understanding of the sun's position during the day is critical to site planning, daylighting design, passive solar design, and controlling unwanted heat gains. In early civilizations, most cultures revered the sun as a deity and under stood its patterns and importance in the cycle of life. Today, such understanding is just as important when considering the relationships between the environment and technology in the design of buildings. We can no longer afford the resources to sustain the construction and operation of buildings with poorly designed glazed areas habitable only through the use of active climate control systems.
We can rely on the patterns of the sun as a constant in the design process and create environments that work with these patterns, climate, and well considered design intents.
1. THE SUN AND ITS POSITION
The sun is a giant star and the largest object in the solar system. The sun's energy is produced by nuclear fusion that occurs at temperatures in the range of 18-25 million ºF (10-14 million ºC). The energy from thermonuclear fusion at the sun's surface is released as electromagnetic radiation at approximately 10 million ºF (5.6 million ºC). The solar spectrum (FIG. 1) consists of approximately 5% ultraviolet (shortwave) radiation (less than 350 nm), 46% light-what we see-(350 to 750 nm), and 49% infrared (long-wave) radiation (greater than 750 nm). Though 93 million miles from Earth, the amount of the sun's radiation (heat energy) reaching the Earth's outer atmosphere is relatively stable and is called the solar constant -433 Btu/ft 2 hr (1.37 kW/m^2). Some annual variation in the solar constant occurs because of the elliptical orbit of the Earth around the sun, but it is so small that it has little effect on building design. The length of radiation's path through the atmosphere is the most important factor in determining how much radiation reaches the surface of the Earth. This received radiation is termed insolation.
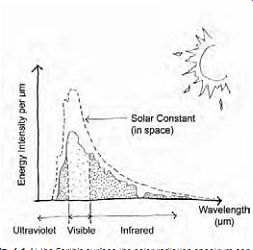
FIG. 1 At the Earth's surface the solar radiation spectrum consists of ultraviolet
radiation, visible radiation (light), and infrared radiation.
(a) Earth's Rotation and Tilt
The Earth's axis of rotation is tilted at 23.5º (precisely, 23.47º), also known as its declination. The Earth travels in the plane of the ecliptic (FIG. 2) in its orbit around the sun. The tilt of the Earth is toward the sun (June +23.5º) or away from the sun (December -23.5º). This tilt is responsible for the seasons. In the northern hemisphere in June, the sun's direct radiation is perpendicular to the Earth's surface; in December, there are fewer hours of sun, and the radiation passes through a longer, non-perpendicular, length of atmosphere to reach the Earth. The rotation of the Earth (once every 24 hours) and its tilt determine the length of atmosphere that solar radiation passes through and consequently how much energy the Earth's surface receives.
(b) Altitude and Azimuth
The position of the sun at any instant with respect to an observer on the ground is defined by its altitude angle and its azimuth angle. The altitude of the sun is the angle between the horizon and the sun's position above the horizon. The altitude varies during the day, beginning and ending at 0º at sunrise and sunset and reaching a daily maximum at solar noon. The altitude angle at noon varies from day to day, reaching a yearly maximum on June 21 (the summer solstice), a minimum on December 21 (the winter solstice), and a point halfway between the two on the vernal and autumnal equinoxes (March 21 and September 21). The azimuth (also called the solar bearing angle) is the angle along the horizon between the projected position of the sun and true (solar) south. Note that the azimuth is referenced from south herein, whereas in other sources it is sometimes referenced from north; there is no clear consensus on this issue. Refer to FIG. 3 and Tables C.11 to C.18 for solar position and insolation information.
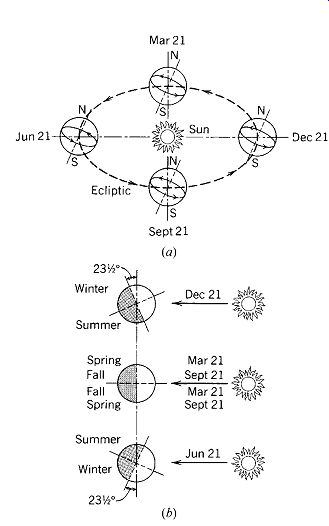
FIG. 2 (a) The ecliptic is the annual path of the Earth around the sun.
(b) The tilt of the Earth's axis in the plane of the ecliptic results in the
seasonal variations. In the northern hemisphere the Earth tilts away from the
sun in December (-23.5º), resulting in winter's low sun altitude and cold weather.
In June the effect is reversed.
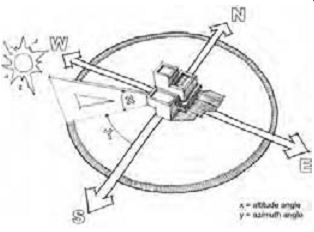
FIG. 3 Altitude and azimuth angles.
Referring to the graphic relationships in FIG. 2, the height of the sun in the sky (altitude angle) depends upon the observer's position on the Earth (the latitude) and the seasonal changes (the tilt of the Earth). This can be expressed in Equation 1, as follows:
altitude angle at solar noon = 90º - latitude ± declination ( 1)
For example, the solar altitude for Minneapolis (44.9ºN) for various seasons at solar noon is:
Maximum (June 21): = 90º - ~45º + 23.5º = 68.5º Equinox (Mar/Sept 21) = 90º - ~45º - 0º = 45º Minimum (Dec 21) = 90º - ~45º - 23.5º = 21.5º These relations are shown graphically in FIG. 4.
The azimuth angle during its path from sun rise to sunset changes with the season. On the equinoxes (March 21 and September 21) the sun rises due east and sets due west. In the northern hemisphere, the sun rises north of east and sets north of west between March 22 and September 20. This is shown graphically in FIG. 5 for one specific latitude (32ºN). Sunrise on June 21 is 28.5º north of east, and sunset is correspondingly 28.5º north of west. On December 21 sunrise and sunset are 28.5º south of east and west.
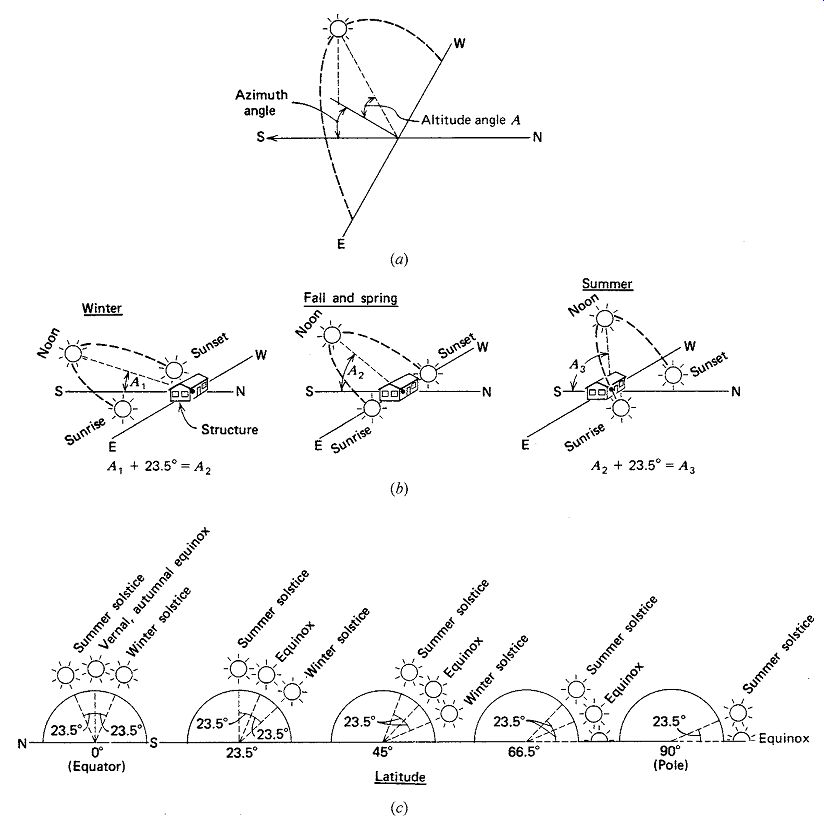
FIG. 4 (a) The position of the sun is expressed in terms of vertical angle
above the horizon (altitude) and horizontal angle (azimuth, measured from the
south). (b) Approximate position of the sun in each of the seasons at a mid-northern
latitude (approximately 45º). Note that the altitude angle is maximum in summer,
minimum in winter, and in between in spring and fall. (c) Maximum sun altitude
at various latitudes for both solstices and equinoxes.
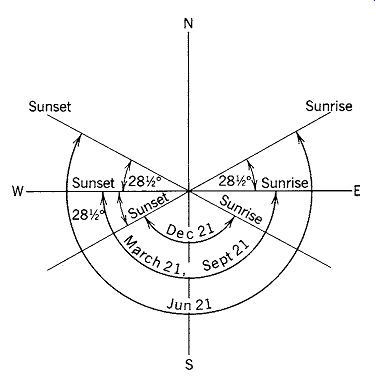
FIG. 5 A diagram of the sun's azimuth path from sunrise to sunset projected
on a horizontal plane for solstices and equinoxes at latitude 32º N ( Jerusalem,
Savannah, Tucson). The sun's azimuth angle, like its altitude, varies with
the time of day and the date.
A designer can use three basic solar pattern concepts when designing with the sun:
1. The altitude of the sun is highest in summer, lowest in winter, and in between in spring and fall for all latitudes. The maximum difference in altitude angle between summer and winter solstices is about 47º.
2. The daily maximum altitude of the sun increases as a location approaches the equator (low latitudes, either north or south). The seasonal altitude variation, however, is the same for all latitudes (except at those extreme north and south latitudes where the sun is above or below the horizon for extended time periods). This factor not only has a pronounced effect on the design and efficacy of sun-shading devices, but also affects exterior daylight illuminance levels.
3. The azimuth angle of the sun is dictated by the time of day and by the season. The sun by definition traverses the sky between sunrise and sun set and in the northern hemisphere rises north of east during the summer, due east on the equinoxes, and south of east during the winter.
The principal significance of the azimuth angle is its role as an important consideration when orienting a building on a site, establishing building exposures, and analyzing shading angles.
2. SOLAR VERSUS CLOCK TIME
The basis of all timekeeping is the length of the solar day, that is, one full rotation of the Earth on its axis.
The Earth's motion on the ecliptic is not uniform- it moves more rapidly when farther from the sun.
As a result, the actual length of a solar day varies.
Since it is impractical to use timepieces that need daily adjustment, we use an average, or mean solar day, as the basis for timekeeping. There are three reasons for the difference between solar time and clock time:
1. Location within a time zone. The 360º circumference of the Earth is divided into 24 one-hour time zones, each with a width of approximately 15º of longitude, which corresponds to approximately 1000 miles (1610 km). An observer located at any point other than directly on a standard time zone reference longitude (normally in the center of a time zone) must make a time correction for his/her distance from the reference longitude. (In some countries, a reference longitude is more than 30 minutes from time zone extremes. In such places, the time correction for longitude plus the equation of time can total well over an hour. This situation does not exist in the continental United States.)
2. Equation of time. The speed of the Earth in its orbit around the sun is nonuniform; it moves more rapidly when farther from the sun. As a result, the actual length of the solar day varies as defined by the equation of time (FIG. 6a). The extent of this variation can be determined from a curve called the analemma (FIG. 6b) or from tabulations in various sources. The analemma is the shape that results if the sun's position in the sky is recorded at the same time of day throughout the year.
3. Daylight saving time (DST). During DST, clocks are moved forward one hour to effectively give (from the morning) one more hour of daylight in the evening during the summer months.
(Note: The official term is daylight saving time, not daylight savings time.) The purpose of DST is to make better use of daylight. In most of the United States (except Arizona and Hawaii), DST begins at 2:00 A.M. on the second Sunday of March and reverts back to standard time on the first Sunday in November. In the European Union, Summer Time begins at 1:00 A.M. Universal Time (Greenwich Mean Time) on the last Sunday in March and ends the last Sunday in October.
Unless otherwise clearly noted, most solar position tables and charts (including sun path diagrams) are based upon solar time, not clock time.
This must be considered when solar-driven loads are being added to clock-driven loads (for example, the heat gain from the western sun is being added to the heat gain from office occupants to deter mine the total load). Such an addition must use coincident values, and solar and clock times are rarely coincident.
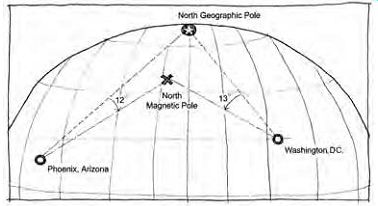
FIG. 7 The concept of magnetic deviation (from true north), illustrated
for Phoenix, Arizona (12º easterly) and Washington, DC (13º westerly).
3. TRUE SOUTH AND MAGNETIC DEVIATION
Working from a "true south" or "solar south" orientation (opposite of "true north," location of the Earth's axis of rotation) is the starting point in the planning and design of a building, particularly for passive solar strategies. When a compass is used on a building site to find north, the compass yields a reading toward magnetic north, determined by the Earth's internal magnetic field. This is usually (depending upon the locale) not the same as true north. Figure 7 illustrates this phenomenon. To correct between magnetic north (compass) and true north (solar), a magnetic deviation is applied to the compass reading. Depending upon the location on the Earth's surface, the deviation may be as large as 50º-but in most locations this is not the case. It should be noted that the magnetic field is not uniform, stationary, or perfectly aligned with the Earth's poles; thus, magnetic deviations can change and have changed over time.
4. SUNPATH PROJECTIONS
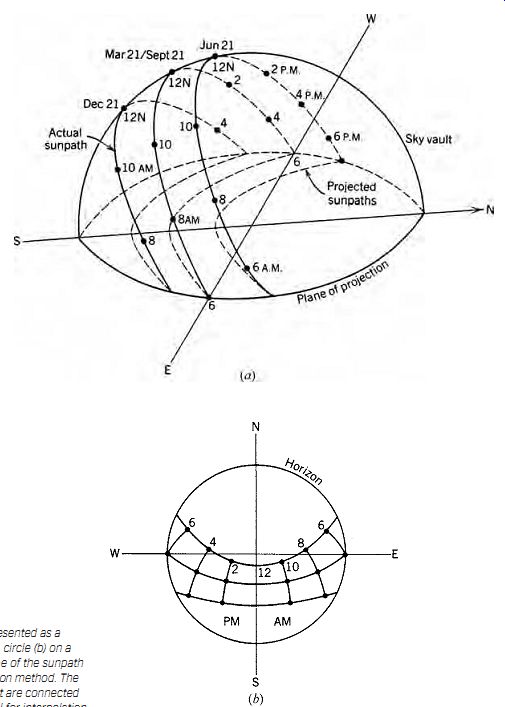
FIG. 8 (a) The sky vault is represented as a hemisphere, which projects
as a circle (b) on a projection plane. The exact shape of the sunpath chart
depends upon the projection method. The hour points on the sunpath chart are
connected to form hour lines that are useful for interpolation.
Design tools such as sunpath projection charts can be used to assess site conditions, orient a building, or provide information critical for passive solar design. Sunpath charts represent the sun's position throughout the year. There are two fundamental types of sunpath projections: vertical and horizontal. Horizontal projections are more commonly encountered. The basic idea behind the horizontal projection is shown in FIG. 8. The sky vault is represented as a hemisphere that projects as a circle, the center of which is the zenith. The observer looks down onto the hemispherical sky vault and projects the sunpaths from the vault onto the two dimensional projected circle. The basic difference between the various horizontal projections is in the spacing between circles of equal altitude. Vertical projection charts are also available.
Four of the more common sunpath projections are (1) gnomonic, (2) equidistant, (3) rectilinear, and (4) stereographic.
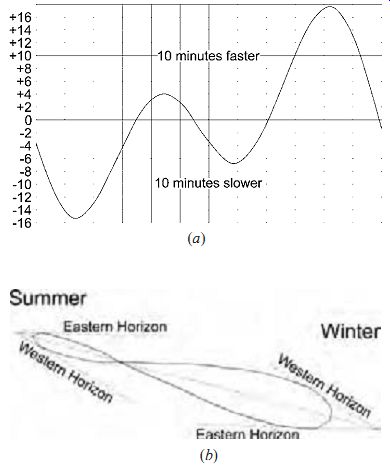
FIG. 6 (a) Equation of time. (b) The analemma is a miniature almanac where
the vertical coordinates of the path represent the sun's declination on a particular
day of the year, while the horizontal coordinates tell how much the sun is
ahead of or behind clock time on that day.
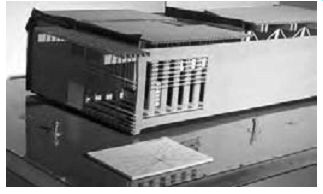
FIG. 10 A sunpeg chart attached to the base of a scale model to study solar
access and shadow patterns in and about a building.
1. The gnomonic projection (used with sundials and sunpeg charts) is derived from the sundial. The observer is at the center of the projection; there fore, low sun angles (sunrise, sunset) extend to infinity. For this reason, this method is rarely used for solar charts but is easily applied to building shadow studies. Sunpeg charts for specific latitudes (see FIG. 9 and Section D.2) will show the exact position of sun penetration and shadow on a model of any scale, on any date, at any time of day between shortly after sun rise and shortly before sunset. Use of the sun peg chart is explained in the following outline and shown in FIG. 10.
• Find the sunpeg chart corresponding to the nearest latitude for a site.
• Make a copy of this chart. If the copier changes the chart size, the peg height line will also change; there should be no problem.
• Construct a "peg" (gnomon) whose finished height above the chart surface corresponds exactly to the "peg height" shown on the copy of the chart. This peg must stand and remain perfectly vertical relative to the model and not be bumped out of vertical alignment.
• Mount the copy of the chart on the model to be tested. The chart must be perfectly horizontal over its entire surface, and the north arrow on the chart must correspond to true (solar) north on the model.
• Choose a test time and date. Take the model out into direct sunlight. (With a small model, a camera tripod might serve as a mount.) Tilt the model until the shadow of the peg points toward
the intersection of the chosen time line and the chosen date curve. When the end of the peg's shadow touches this intersection, the model will show the same sun-shadow patterns as would occur on the time and date chosen.
2. The equidistant projection (horizontal, polar) is used almost exclusively in the United States because of the ready availability and wide acceptance of the sunpath charts provided in the Pilkington (formerly Libbey Owens Ford)
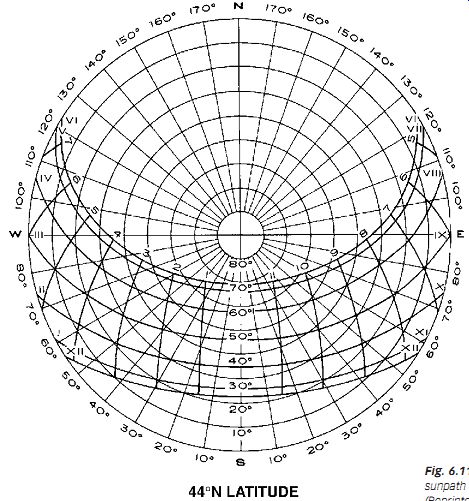
FIG. 11 Equidistant (horizontal, polar) sunpath diagram for 44º N latitude.
Sun Angle Calculator. The observer moves around the skydome, like the sun's view to the Earth. Figure 11 shows a sample equidistant projection sunpath diagram. A full set of equidistant projections is provided in Section D.3.
This projection method is equally applicable to all latitudes, and a latitude-specific sunpath is needed for a location under study. The Pilkington Sun Angle Calculator sunpath diagrams are available in steps of 4º of latitude between 24º and 52º latitudes.
3. The rectilinear projection (vertical, cylindrical) is a two-dimensional graph of the sun's position in Cartesian coordinates. Azimuth is plotted along the horizontal axis and altitude on the vertical axis. The development of this type of chart is shown in FIG. 12. These charts are actually graphs superimposed on the eye of an observer. At the vertical center of each chart, the observer is looking due south. The horizon (a horizontal plane at the observer's eye level) is the line at the bottom of the chart. A set of rectilinear charts for several latitudes is found in Section D.4.
These charts may also be used to easily determine the number of hours of greatest insolation, that is, what percentage of clear-day insolation is gained each hour by an unshaded south-facing vertical window (FIG. 13). This emphasis on south orientation calls attention to its useful characteristic of receiving more sun in winter and less sun in summer than any other orientation. To convert these percentages to actual heat gains, see Tables C.1 to C.10 (for clear days at a given latitude) or Tables C.19 and C.20 for average day data by climate station (January and July only).
4. The stereographic projection (circular, equal spacing) also represents the sun's changing position in the sky throughout the day and year. The format is like a fish-eye photograph of the sky pointed to the zenith directly above.
The various paths of the sun throughout the year can be projected onto the sky, then "flattened." The principal advantage of this projection is that it is very simple to draw sunpaths at any scale and for any latitude without having to rely on published sunpaths. Thus, for any serious sunshading design, a designer can pre pare a large-scale sunpath chart at the exact latitude of a project and do accurate graphical analysis.
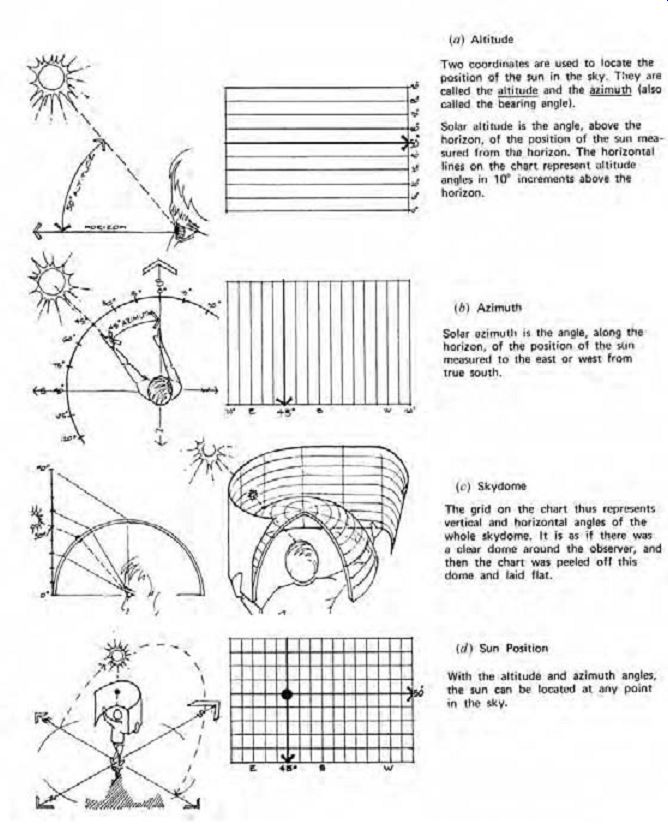
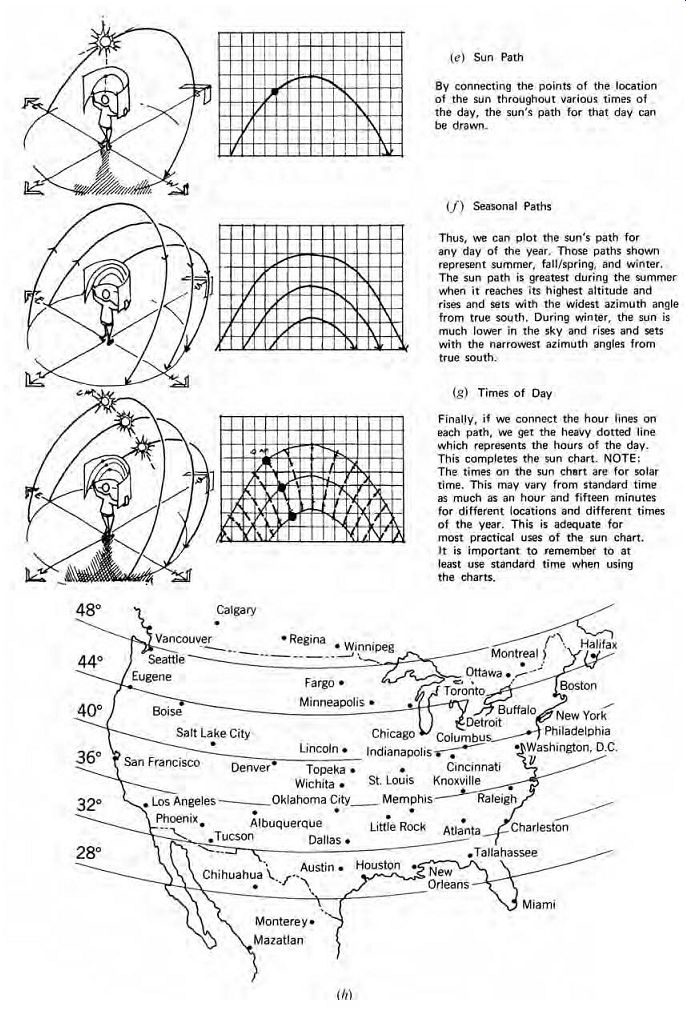
FIG. 12 Illustrations (a) through (g) describe the development of the rectilinear
sunpath chart. (h) U.S. map showing cities along similar latitudes.
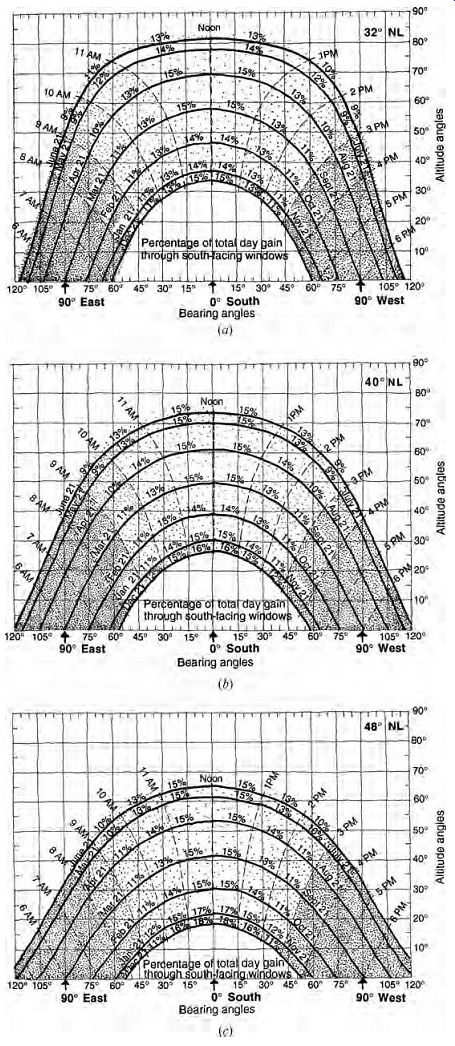
FIG. 13 Sunpath charts for three latitudes (32º, 40º, 48º) show the approximate
percentage of clear-day insolation for south-facing windows for each of the
maximum hours of sun each month.
The design of sunshading devices necessitates projecting the three-dimensional solar path onto a two-dimensional surface. Stereographic and equidistant projections are the most popular for sun shading analysis.
5. SHADING
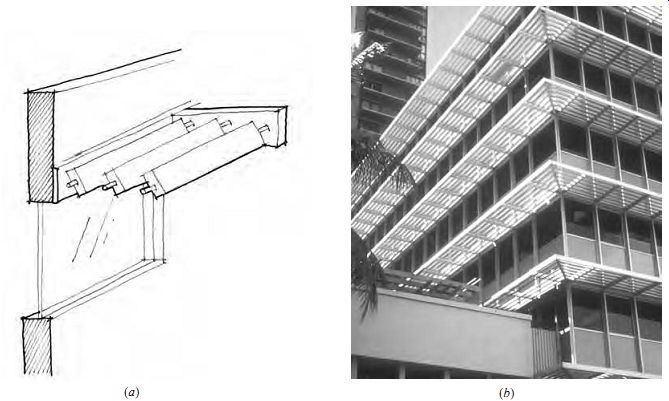
FIG. 14 (a) Overhang with horizontal louvers. (b) Horizontal louvers allow
free air movement-office building in Honolulu, Hawaii.
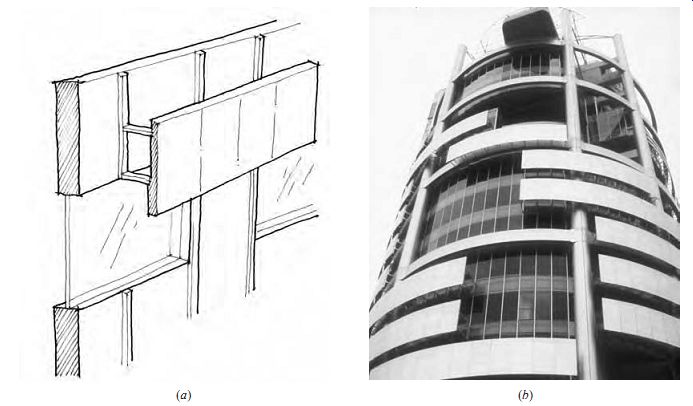
FIG. 15 (a) Overhang using a series of vertical panels. (b) Application
of horizontal overhangs at the IBM Tower in Kuala Lumpur, Malaysia.
Shading windows from solar heat gain is a key design strategy for passive cooling and to reduce cooling loads on active HVAC systems. Shading the opaque building envelope is also important, but since thermal resistance is usually greater through such elements than through glazing, the discussion in this section refers primarily to design strategies for shading windows oriented south, east, and west.
Northern windows often also need shading devices, contrary to the myth that the north façade never receives direct beam radiation.
(a) Shading for Orientation
Because of the high altitude of the sun, the most effective shading device for south-facing windows during the summer is a horizontal overhang. On east- and west-facing windows, a horizontal over hang is somewhat effective when the sun is at high positions in the sky but is not effective at low-altitude angles. A variety of shading devices are illustrated by the diagrams and examples in Figs. 14- 18.
Direct solar gain through east- and west-facing windows can be an extraordinary heat gain liability and produce thermal and visual discomfort. During the early design stages, it is best to orient spaces to face north or south to avoid the east/west sun's low angle. If this is not possible, vertical fins are an effective strategy for east and west orientations. Eggcrate shading devices (a combination of overhangs and fins) provide optimal shading particularly in hot climates (FIG. 19). North-facing windows receive direct solar radiation in the summer in the early morning and near sunset, when the altitude of the sun is very low. For shading on the north side at these times, vertical fins are most effective.
(b) Operable Shading Devices
Operable exterior shading devices are useful because they respond to daily and seasonal variations in solar and weather patterns in ways that fixed shading devices simply cannot do. The operation of a movable shading device can be as simple as twice-a-year adjustment-for example, manually extending roller shades, awnings, rotating fins, or louvers at the beginning of summer and retracting the shade after the hot season has ended (in fall). These devices are very effective at blocking low sun angles from the east or west. More complex movable devices are typically on automated daily and seasonal programs. Although many facility managers are of the opinion that movable exterior shading devices require high maintenance and are prone to malfunctioning, the designer can apply appropriate technology to provide a low maintenance solution.
Designers can also situate deciduous trees and vines at key locations around a building, which will act as natural shading devices with a natural cycle for shade in the summer and loss of leaves in the winter (FIG. 20). Plants have the advantages of costing little, reducing glare, providing an attractive connection to nature, and reducing exterior surface (wall and ground) temperatures.
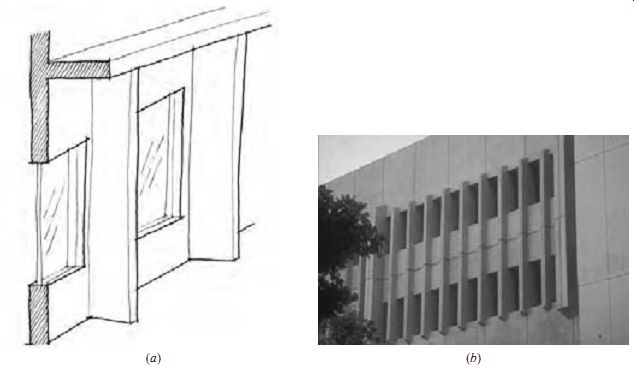
FIG. 16 (a) Vertical fins. (b) Fixed vertical fins on a government building
in Honolulu, Hawaii.
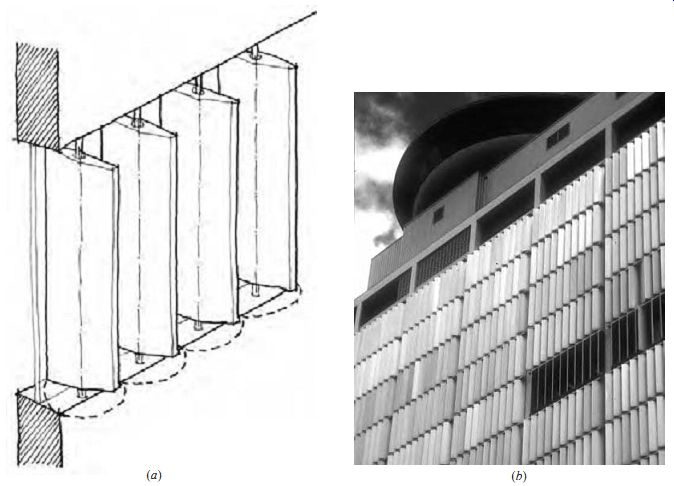
FIG. 17 (a) Movable fins. (b) Movable fins are positioned according to the
sun's position at the Ala Moana office building in Honolulu, Hawaii. These
effective shading devices were removed when the building was remodeled to make
it look more contemporary.
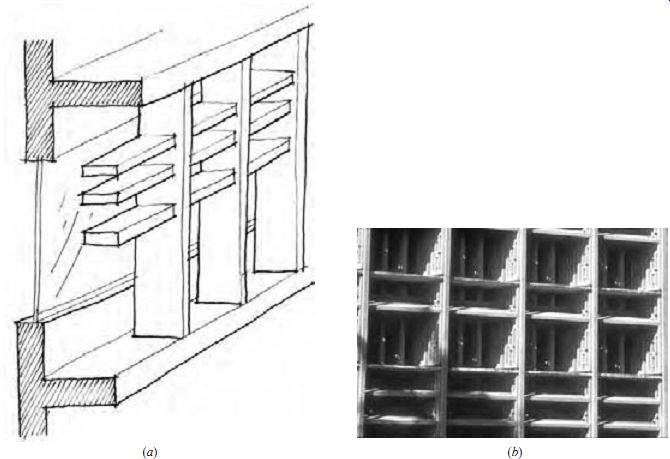
FIG. 18 (a) Eggcrate shading device. (b) Modified eggcrate to allow air
movement and lighter structure at the Board of Water Supply in Honolulu, Hawaii.
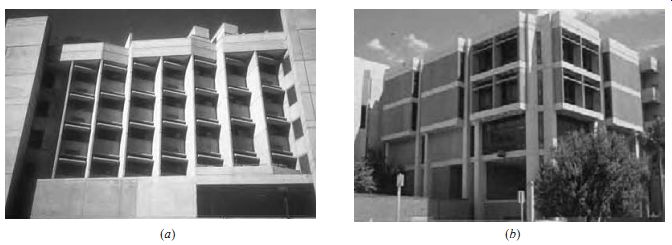
FIG. 19--Integration of
eggcrate shading devices into the envelope at (a) the Hawaii Medical Services
Association building in Honolulu, Hawaii, and (b) the University of Arizona
library in Tucson.
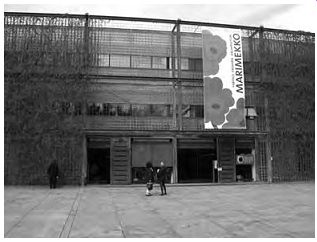
FIG. 20--Vines grow on an exterior structure at the Finnish Embassy in Washington,
DC.
6. SHADOW ANGLES AND SHADING MASKS
Altitude and azimuth angles are very useful in understanding solar position and sunpath diagrams, but are much less useful in defining the shadow angles cast by a projection on a wall exposed to the sun. More angles come into play with shading device design.
(a) Shadow Angles
When designing shading devices, the geometry of the device itself and its relationship to the face of a building produce a number of angles relative to the desired shadow being cast. Since there is no universal nomenclature for these relationships, the angles involved in the design of shading devices will be very carefully defined. Refer to FIG. 21, which shows the shadow cast by a horizontal overhang on a wall exposed to sunlight. Note that the shadow is defined by two angles: the vertical shadow angle (VSA), which indicates the position of the leading edge of the shadow as defined from the leading edge of the overhang, and the horizontal shadow angle (HSA), which defines the leading edge of a shadow cast by a vertical element (indicated by a dashed line) as defined with respect to that element's leading edge. The terms vertical shadow angle and horizontal shadow angle are in use throughout the world, although in the United States the vertical shadow angle is also known widely as the profile angle because it is so designated on the Pilkington Sun Angle Calculator.
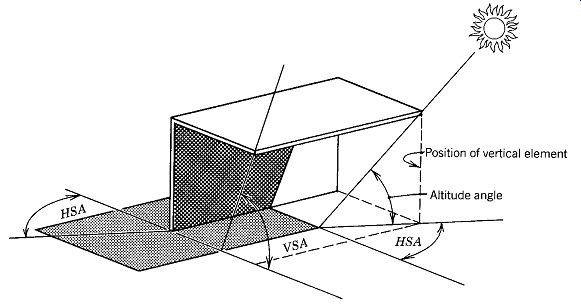
FIG. 21 The shadow cast by a horizontal overhang is best defined by the
vertical shadow angle (VSA) and the horizontal shadow angle (HSA). The VSA
is also known as the profile angle in the United States.
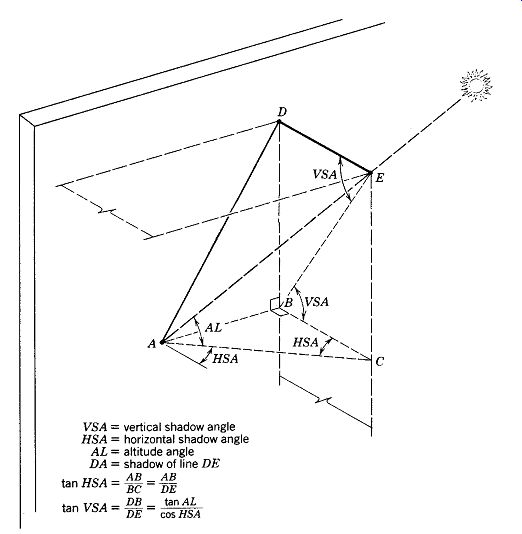
FIG. 22 The shadow DA cast by the intersection line DE between a horizontal
and a vertical shading element defines the edge of each of these shadows. DE
can also be thought of as a pin, normal to and extending from the wall, casting
a shadow, DA, on the wall.
The location and size of line DA are best defined in terms of angles VSA and HSA.
Figure 22 shows the same information in slightly different form; line DA is the shadow cast by line DE, which is the intersection between a horizontal projection and a vertical projection. This line is particularly important in determining the required extent of a shading element, as will be shown in the following sections.
(b) Shading Masks
A shading mask is a sunpath chart (horizontal projection) that shows the shadow cast by a particular shading device, as shown in FIG. 23. For a horizontal shading device, the leading edge of the shadow cast by all horizontal elements with the same VSA (profile angle) projects as a segmental line, and when plotted on the sunpath chart, it is shown as a segmental mask. To draw this segment, a protractor is required. The Pilkington Sun Angle Calculator includes a profile angle protractor (an overlay to the sunpath chart) to draw the required segment. With no shading, there is no shadow, the VSA is 90º, and no segment exists. With a very deep overhang, the VSA approaches 0º and the unshaded area shrinks.
For vertical shading elements, such as fins (FIG. 23b), the leading edge of vertical shading elements forms a shadow, shown as radii projecting from the center, which forms an angle HSA, from a line normal to the wall. These radial lines can be drawn with the assistance of an ordinary protractor or by use of the protractor in FIG. 23c. The full segments and full radial lines of the shading masks are of infinitely long elements, which, of course, do not actually exist. Shading masks that appear in the literature are frequently drawn as if for infinite elements, and the masks must be truncated for real-world shading design.
(c) Use of Shading Masks
A shading mask is drawn on some transparent medium (e.g., paper or plastic sheet) and laid on top of a sunpath diagram for the proper latitude drawn to the same scale (see FIG. 24, which illustrates the placement of a shading mask). Its center point is placed on the center point of the sunpath diagram, and it is rotated until its facing direction (the direction normal to the wall) is aligned with the appropriate azimuth line on the sunpath diagram.
Assuming that the shading mask has been correctly drawn to provide shading for the window (typically 50% or 100% coverage), the shaded hours for the window and device in question can then be read directly from the underlying sunpath diagram as summarized in Table 6.1. (This is why the shading mask must be drawn on a transparent medium.) It is extremely important to note that a horizontal overhang shading element the same width as a window can provide full shade for the window only when the sun is exactly opposite the window (when the solar-window azimuth is 0º). This situation occurs for only an instant (FIG. 25). At all other times, some part of the window will be exposed to the sun. To provide full shading for more than an instant with a horizontal element and no vertical (side) elements, an overhang must extend beyond the sides of the window. The amount of such an extension can be determined both graphically and analytically. Since graphic solutions are amply treated in the literature (Harkness and Mehta, 1978; Lim et al., 1979; Cowan, 1980), the focus here is the analytic solution. In reviewing this discussion, keep in mind the requirement that shading masks for 100% coverage must be prepared so that the extremities of the opening are shaded.
(d) Designing Finite Horizontal Shading Devices
Although any percentage of window shading coverage is possible, most shading devices are designed to give either 50% or 100% coverage. Deciding upon shading coverage is the first step in design.
The second step is to establish the required depth of the shading device (the distance it projects from the wall). Figure 6.26 shows how the required depth and the corresponding segmental mask are determined. At times, because of window areas left unshaded by the original overhang, it is necessary to determine the required side extensions beyond the window's edges.
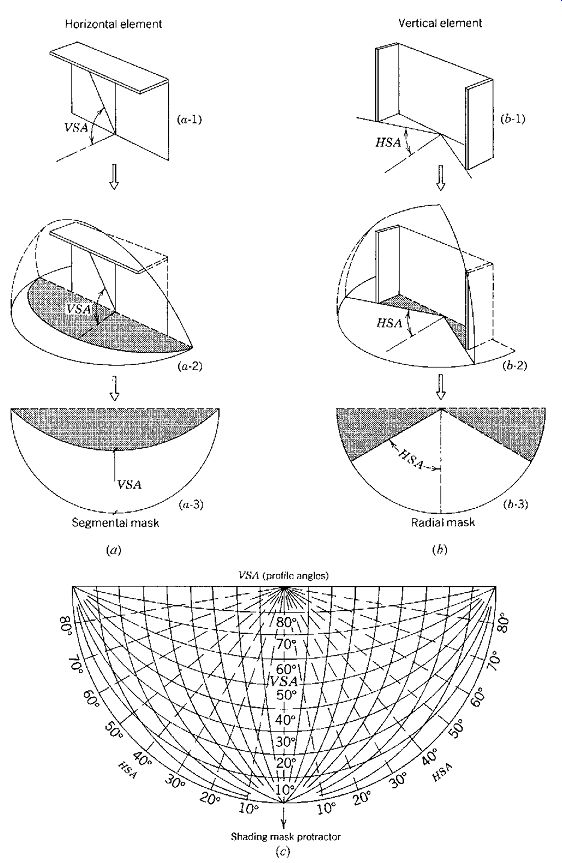
FIG. 23 A shading mask is the horizontal projection of the shadow cast by
the elements with the same VSA or HSA. Thus, any infinitely long horizontal
element with the VSA shown in (a-1) will have a shading mask, as shown in (a-3).
Similarly, any infinitely high vertical elements with the HSA shown in (b-1)
will have the shading mask shown in (b-3). A protractor (c) is required to
draw the segmental horizontal element mask properly.
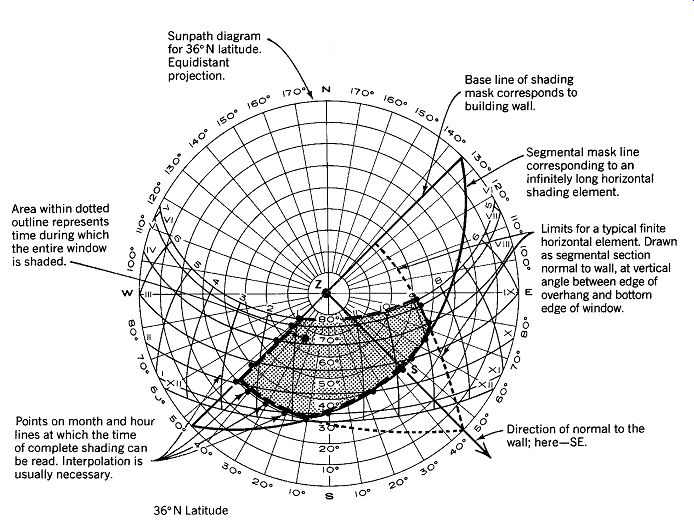
FIG. 24 A shading mask for a typical horizontal overhang on a window is
laid over a sunpath diagram to permit determination of the shaded hours. The
mask is drawn to provide 100% shading for the entire window. The hours during
which the entire window is shaded are determined by the intersection of the
mask perimeter with the date/hour lines of the sunpath diagram, and are tabulated
in Table 1. Only during the hours falling within the dotted area is a window
fully shaded by an overhang element that is as wide as the window. The shading
element shown here is not symmetrical about the center, indicating that an
extension to the left was used to provide a larger shade period after noon.
This is typical for east-facing windows and is reversed for western exposures.
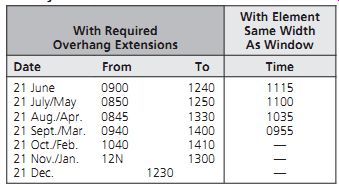
TABLE 1 Time of Day When Window Is Fully Shaded
Due to the symmetry of solar motion about the ecliptic, the position of the sun is symmetrical on both sides of its maximum/minimum positions, that is, the solstices. Thus, the sun's position on May 21 is the same as on July 21, since both dates are 1 month from the summer solstice. As a result, any fixed shading device will give the same shade in the spring (before 21 June) as in the summer (after 21 June). Since in many locations spring is cool, desired late summer shading will produce spring shading that may not be desirable. Solutions to this apparent dilemma are either to use a movable or a variable-size fixed shading device or to compromise on the amount of shading, that is, to design for 50% shading for late summer (and early spring) and 100% shading for early summer (and late spring).
(e) Design Approaches
In addition to the approach just described, design might start with conceptual sketches of an appropriate shading device. As the sketches are developed into scaled drawings, a sectional drawing will show the geometry of the building. The VSA for 100% shading would be an angle from the windowsill to the outer edge of the overhang. Once the VSA is established, a shading mask can be created and overlaid onto the appropriate sunpath chart to determine whether there is adequate shading during specific times of the day and year.
Shading devices can greatly enrich the aesthetics of a building as well as improve performance. Examples of shading device models for various orientations (FIG. 27) show a range of shading design solutions for a building in a temper ate climate.
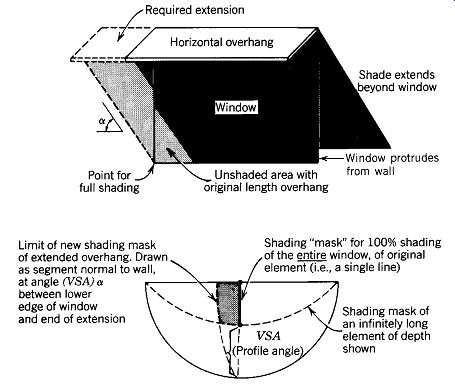
FIG. 25 A horizontal overhang with sufficient depth to provide 100% shading
can provide full shading only when the sun is exactly opposite a window. At
any other time, part of the window will be exposed to the sun. Full shading
from low early morning or late afternoon sun is not possible with horizontal
elements.
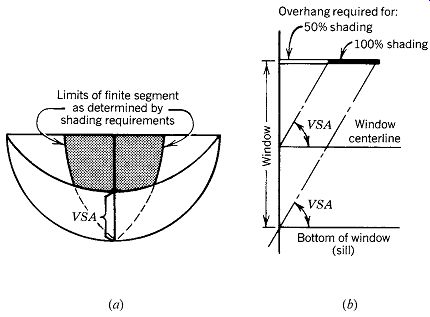
FIG. 26 One way to find the required depth of a horizontal overhang is to
establish the required segmental shading mask (a) and read the VSA (profile
angle) off the protractor that corresponds to the segment. Draw a wall section
(b) to scale with the VSA. The VSA can be drawn for 50% shading coverage, 100%
coverage, or any other value. The depth of the overhang can be measured directly
from the section. Alternatively, if the overhang depth is known, the segment
can be drawn.
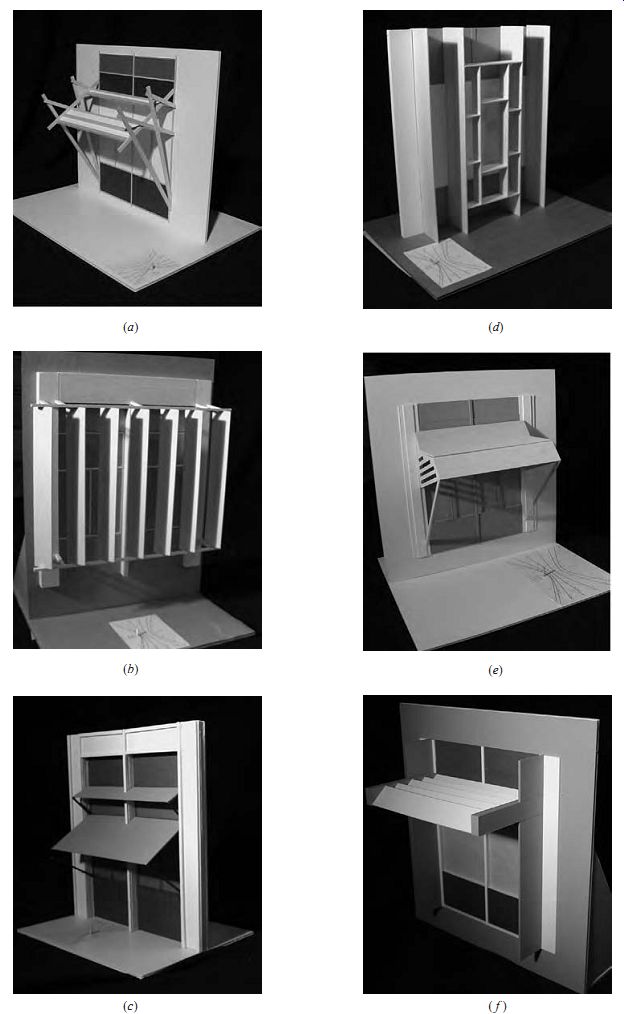
FIG. 27 Examples of shading device models (a-f ) illustrate a variety of
design responses to orientation, shading requirements, and view for a university
building located at 44º N latitude.
References and Resources
AIA. 1981. Ramsey, C. G. and H. R. Sleeper. Architectural Graphic Standards, 8th ed. American Institute of Architects/John Wiley & Sons. New York.
Cowan, H. J. (ed.). 1980. Solar Energy Applications in the Design of Buildings. Applied Science Publishers. London.
Geomagnetic Maps (showing magnetic deviation): Harkness, E. and M. Mehta. 1978. Solar Radiation Control in Buildings. Applied Science Publishers. London.
Lim, B. P., K. R. Rao, K. Tharmaratnam, and A. M. Mattar. 1979. Environmental Factors in the Design of Building Fenestration. Applied Science Publishers. London.
Mazria, E. 1979. The Passive Solar Energy Book: A Complete Guide to Passive Solar Home, Greenhouse and Building Design. Rodale Press. Emmaus, PA.
Olgyay, A. and V. Olgyay. 1951. Solar Control and Shading Devices. Princeton University Press. Princeton, NJ.
Online Sun Angle Calculator:
Pilkington Sun Angle Calculator. 1975. The Pilkington Sun Angle Calculator (formerly the Libbey Owens Ford Sun Angle Calculator) is available through the Society of Building Science Educators (SBSE).
Sundials.org (information on clock vs. solar time): Szokolay, S. V. 1980. Environmental Science Handbook. Halsted/John Wiley & Sons. New York.
University of Oregon (sunpath diagram software)
U.S. Naval Observatory (complete sun and moon data for one day)