AMAZON multi-meters discounts AMAZON oscilloscope discounts
ONE OF THE EARLIEST REASONS FOR building was to create shelter from the climate and to enhance thermal comfort. This section is about the interrelationship among bodies, buildings, and climate. It begins by discussing bodily heat flow, then thermal comfort, and then design strategies that are appropriate to various climates.
1. THE BODY
Because we are alive, we are always generating body heat. Because the body's core must stay within a narrow temperature range, we nearly always need to lose this internally generated heat to our environment. The rate at which we produce heat changes frequently, as does the environment's ability to accept heat. To regulate our body's heat loss, we have available three common layers between our body cores and the environment: a first skin, which is our own; a second skin, our clothing; and a third skin, a building.
(a) Metabolism
The rate at which we generate heat (our metabolic rate) depends mostly upon our level of muscular activity, partly upon what we eat and drink (and when), and partly on where we are in our nor mal daily cycle. Our heat production is measured in metabolic (MET) units (Table 1). One MET is defined as 50 kcal/h m2 (equal to 18.4 Btu/h ft 2 or 58.2 W/m2). One MET is the energy produced per unit of surface area by a seated person at rest. Under these conditions, the total heat produced by a normal adult is about 360 Btu/h (106 W). The more active we are, the more heat we produce, and our own (first) skin becomes the most important regulator of heat flow.
Of the many interactions between our skin and the rest of our body, consider these three: touch, blood, and water. The sensation of touch includes pressure and pain as well as heat and cold. The sensations of heat and cold are produced by contact with surfaces or moving air as well as by radiation. They are frequently our signals for shifts in body heat regulation, which is controlled by the thermostat in our brains, called the hypothalamus.
In response to signals from our skin surface and to changes in our core temperature, the hypo thalamus calls for changes in our blood distribution system. If we are too cold, we need to decrease our rate of heat loss, so the flow of blood from our core toward the surface of our skin decreases.
Blood carries heat (in heating, ventilating, and air conditioning [HVAC] terms, we are an "all-water" system): the less exposure to cool air at the skin surface, the less heat is lost. This decreased blood flow toward the surface is called vasoconstriction, and is triggered in part by cold signals from our skin.
In this condition, less water is forced to the skin surface by our sweat glands, which reduces evaporation and therefore heat loss.
Table 1 Metabolic Rates for Typical Tasks
Note the implications of this zoning within the body. We strive to maintain, at all costs, a nearly constant core temperature for our vital organs.
This most protected zone takes thermal precedence over the less vital zone of our extremities, such as the arms and legs; next in priority are our fingers and toes. The farther from our central body mass (fingers and toes) and the greater the surface area (ears), the faster the temperature will drop in cold conditions. The most variable thermal zone of all is our skin surface.
When cold conditions worsen, we get goose bumps, symptoms of our skin's unsuccessful attempt to create insulation by fluffing up our body hair. Because we cannot add insulation this way, we soon increase our metabolic rate, or burn more fuel, by shivering, muscular tension, or increased muscular activity. At the point where shivering incapacitates us, we may reach 6 MET. Before this point, we seek help from our second and then our third skins of clothing and buildings.
The opposite occurs when we are too hot: first, blood flow toward the skin surface increases (vaso-dilation), triggered primarily by warm signals from our core. The sweat glands greatly increase their secretion of water and salt to the skin surfaces. This increases heat loss by evaporation (although salt accumulations impede evaporation by lowering the vapor pressure of water).
(b) Heat Flow
Once blood and water transport our surplus heat to the skin surface, we have four ways to pass it to the environment: convection (air molecules contact our body, absorbing heat), conduction (we touch cooler surfaces, and heat is transferred), radiation (when our skin surface is hotter than other surfaces "seen" but not touched, heat is radiated to these cooler surfaces, and vice versa when other surfaces are hotter than our skin surface), and evaporation (a liquid can evaporate only by removing large quantities of heat from the surface it is leaving). The amount of heat we lose by each of these four methods depends upon the interactions among our metabolism, our clothing, and our environment. Figure 1 illustrates the typical situation of a person at rest as environmental conditions change.
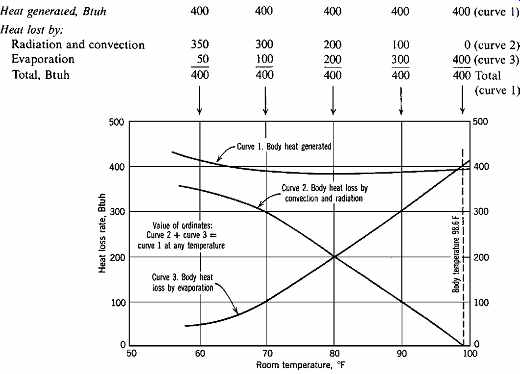
Fig. 1 Heat generated and lost (approximate) by a person at rest (RH fixed
at 45%).
As air and surface temperatures approach our own body temperature, we lose the options of convection, conduction, and radiation. Evaporation becomes essential, so access to dry, moving air is greatly appreciated. As air and surface temperatures fall, evaporation decreases while convection, conduction, and particularly radiation increase.
Under the normally comfortable temperature in Fig. 1 of about 70°F (18°C), the proportions of body heat loss per hour are as follows:
Radiation, convection, and conduction:72%
Evaporation
From skin surface: 15%
From lungs (exhaled air): 7%
Warming of air inhaled to lungs: 3%
Heat expelled in feces and urine: 3%
(c) Clothing
Usually clothing acts as an insulating layer and is particularly effective at retarding radiation, convection, and conduction. As air and surface temperatures in our environment fall well below our body's temperature, we adjust this second skin to provide increased insulation. However, in a hot, humid environment, our first skin needs exposure to moving air to encourage heat loss, yet needs protection from the sun's radiant heat. We need a simple second skin that acts as a sunshade. In a hot, arid environment, our second skin may keep us from losing too much valuable water while also performing the vital role of shading.
The insulating value of clothing is measured in CLO units, 1 CLO being equivalent to the typical American man's business suit in 1941, when the concept of CLO was developed (1 CLO is equal to 0.88 ft 2 h °F/Btu [0.155 m2 K/W]). The total CLO of what you are now wearing can be estimated by assuming 0.15 CLO/lb (0.35 CLO/kg) of clothing weight. The total CLO of your attire may also be estimated by simply adding the CLO of each item from Table 2; this total will be a bit higher than the actual CLO value of the ensemble. Sometimes the position of clothing is as important as its CLO value; consider the role of socks as they separate our feet from contact with a cold floor.
Our second skin is just as likely as our third (building) skin to be more dominated by considerations of style than of thermal regulation; we cannot always count on our clothing-or buildings-to increase our thermal comfort.
Table 2 Typical Insulation Values for Clothing Ensembles
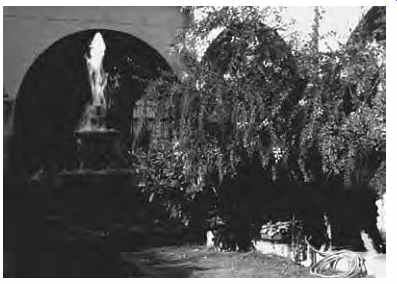
Fig. 2 Indicators of coolness in a courtyard include running water and shade
from vines that move with the breeze.
The senses of sight, sound, touch, smell, and taste all may be involved in a perception of coolness.
2. THERMAL COMFORT
A positive definition of comfort is "a feeling of well being." The more common experience of comfort is simply a lack of discomfort-thermally, of being unconscious of how you are losing heat to your environment. ASHRAE (2004) defines thermal comfort as "that condition of mind which expresses satisfaction with the thermal environment. . . ." There are three categories of factors that affect comfort: personal, measurable environmental, and psychological. Most personal factors are under your control: your metabolism and your clothing, as well as various adaptations such as migration to a more comfortable place, or drinking or eating warm or cold foods. Measurable environmental factors are the familiar tools of the designer: air temperature, surface temperature, air motion, and humidity. Psychological factors are also familiar designers' tools, but they are difficult to quantify for comfort: color, texture, sound, light, movement, and aroma. These factors are often overlooked as we strive to meet the numerical (therefore calculable) physical criteria for thermal comfort. However, our primary design intent is to make people comfortable, and all aspects of buildings are our means to that end.
Consider the courtyard in a hot, dry climate (Fig. 2). Its fountain suggests coolness in the color and texture of its water; running water provides splashing sounds and sparkles of light and may generate some air motion. Vines provide shade, and their leaves sway in the slightest breeze, evidence of at least some air motion. Blossoms of flowering plants yield a cool fragrance that blends with the aroma of moistened surfaces in hot, dry surroundings. The measured coolness of such a courtyard may be but a slight improvement over the environment beyond, but it seems cool.
Then consider a fireplace in a cold climate (Fig. 3). The fire's color is intensely warm, and it dances and casts a flickering light; it crackles, and it yields a smoky aroma (not appreciated by all). Few textures seem hotter than that of glowing coals.
Yet a fireplace might add but slightly to the overall warmth of a room, because it draws in cold air to replace the air that passes up the chimney. We seek a place near the fire for the real radiant warmth, but also for the psychological comfort the fire offers.
In our society, designers are encouraged to take numerical data quite literally. The measurable environmental factors have been tested extensively in laboratories-but exclude other factors. A holistic view of designing for comfort considers numbers as a non-absolute guide; common sense and a designer's own thermal experience play important roles as well. Lisa Heschong's Thermal Delight in Architecture (1979) is an excellent expression of these points of view.
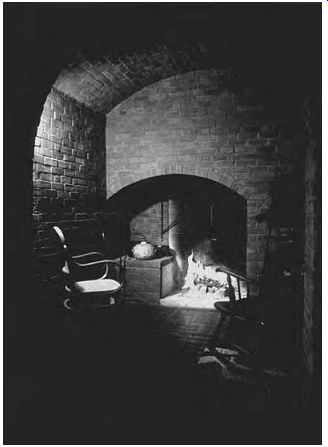
Fig. 3 The open fire seems the very spirit of warmth, despite the heat lost
by large quantities of exhaust air up the chimney.
The senses of sight, sound, touch, and smell all may be involved in a perception of warmth, wrapped in this red brick environment. (Courtesy of the architect and photographer, Edward Allen.)
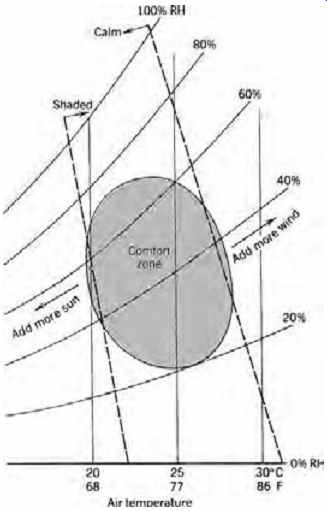
Fig. 4 Comfort zone defined by relative humidity and air temperature.
Ultimately, our buildings will be expected to demonstrate success with regard to the measurable environmental factors of comfort, so it is necessary to understand how air and surface temperatures, air motion, and humidity are related to heat transfer.
Heat Transferred by:
Primarily Dependent upon:
Conduction Surface temperature Convection Air temperature, air motion, humidity Radiation Surface temperature, orientation to the body Evaporation Humidity, air motion, air temperature
From this comparison, it is evident that humidity is relatively unimportant in cold conditions, where heat loss by convection, radiation, and conduction is dominant. However, humidity is of primary importance in hot conditions, dominated by evaporative heat loss. This is further evident in comfort studies, which show that skin temperature is an important factor in cold conditions, whereas skin wettedness (percentage covered by water) is most important in hot conditions.
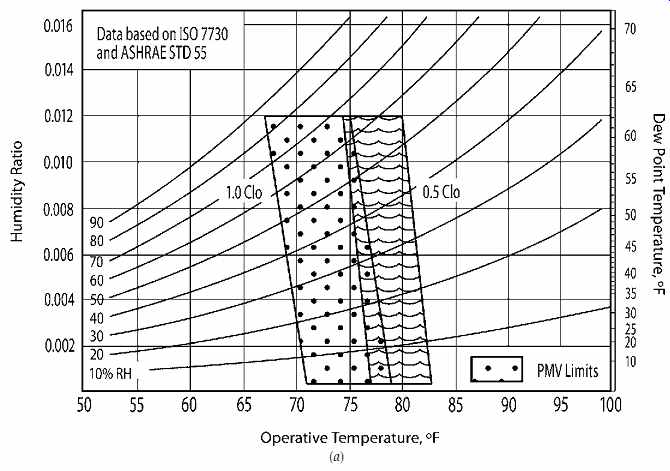
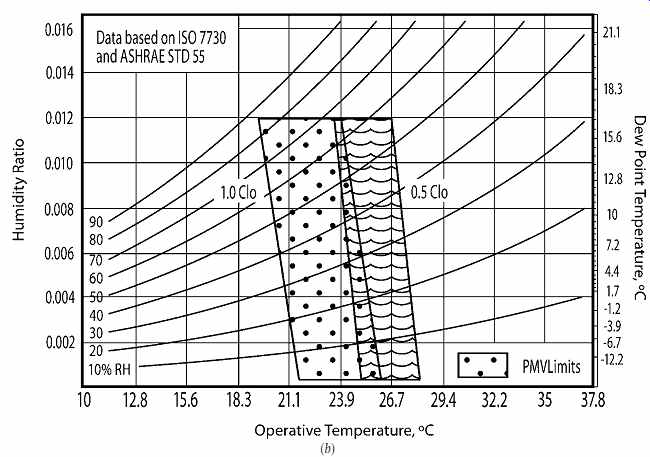
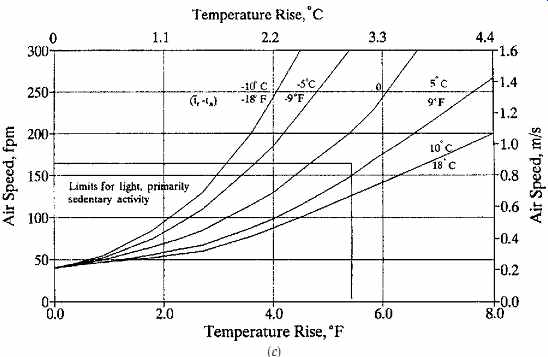
Fig. 5 (a, b) ANSI/ASHRAE Standard 55-2004 comfort zone. (Redrawn by Nathan
Majeski; reprinted with permission of the American Society of Heating, Refrigerating
and Air-Conditioning Engineers, Inc., from ANSI/ASHRAE Standard 55-2004, Thermal
Environmental Conditions for Human Occupancy.) (c) Relationships between increasing
air speeds and temperature relative to thermal comfort. (Reprinted with permission
of the American Society of Heating, Refrigerating and Air-Conditioning Engineers,
Inc., from ANSI/ASHRAE Standard 55-2004, Thermal Environmental Conditions for
Human Occupancy.)
(a) Comfort Standards
The ASHRAE comfort zone (Fig. 5) represents combinations of air temperature and relative humidity that most often produce comfort for a seated North American adult in shirtsleeves (total 0.6 CLO) in the shade and without noticeable air motion. The concept of a comfort zone is diagrammed in Fig. 4, where surface temperatures are assumed to be not markedly different from air temperatures. Moving to the left of this zone, at lower air temperatures, comfort is still attainable if added radiant heat is provided-such as by increasing surface temperatures or providing exposure to the sun. Higher activity and more clothing would also help achieve comfort. Similarly, by moving to the right of the comfort zone (at higher air temperatures), comfort is still attainable by increasing air motion (such as exposure to wind), lowering the activity level, and removing clothing. In both directions limits are soon reached, but the important point is that the basic comfort zone can be expanded by changing environmental variables and/or human behavior.
The human thermal response, perceived as thermal comfort or discomfort, is shaped by four environmental parameters: dry-bulb air tempera ture, relative humidity, radiant temperature, and air speed. These variables can be measured directly or derived from other measurements (using a psychrometric chart where physical properties of moist air and related thermodynamic processes are graphically expressed). Two nonenvironmental parameters, clothing and metabolism, are key personal variables.
Figure 5 (parts a and b) shows the thermal comfort zone as defined by the American Society of Heating, Refrigerating and Air-Conditioning Engineers (ASHRAE), where acceptable ranges of operative temperatures (Top) and relative humidity are given for sedentary (1.0-1.3 MET) persons wearing typical clothing (between 0.5 and 1.0 CLO of thermal insulation). Figure 5 specifies the com fort zone parameters where there should be 80% occupant acceptability for the range of operative temperature and relative humidity, and where air speeds are not greater than 40 ft/min (0.20 m/s). Two zones are shown-one for 0.5 CLO of clothing insulation (assumed worn when the outdoor environment is warm) and one for 1.0 CLO of insulation (for when the outdoor environment is cool). Figure 5c suggests the effect of increased air speeds on thermal comfort. The thermal comfort variables used here are defined as follows:
Dry -Bulb (DB) Temperature. DB temperature is the ambient air temperature as measured by a standard thermometer, thermocouple, or resistance temperature device. DB temperature can be used in combination with globe temperature and air velocity to calculate mean radiant temperature.
Temperature affects comfort in a number of ways and, in combination with the other parameters described in this section, is a key factor in our energy balance, thermal sensation, comfort, discomfort, and perception of air quality.
Operative Temperature. This is the average of the dry bulb temperature and the mean radiant temperature (MRT).
Wet -Bulb (WB) Temperature. WB temperature is measured by a thermometer with a wetted bulb rotated rapidly in the air to cause evaporation of its moisture-as with the sling psychrometer shown in Fig. 6. In dry air the moisture readily evaporates and draws heat out of the thermometer to produce a lower temperature reading, called the wet-bulb depression (the difference between DB and WB temperatures). A large depression is indicative of low relative humidity (RH). Lower evaporation, as when the air is already moisture-laden, results in a small wet-bulb depression and indicates high RH. Note that at 100% RH, DB and WB temperatures are equal.
Relative Humidity may be measured directly or derived from DB and WB temperatures, and is the ratio of the actual density of water vapor in air to the maximum density of water vapor that such air could contain, at the same temperature, if it were 100% saturated.
Mean Radiant Temperature (MRT). The radiant temperatures of surrounding surfaces influence human comfort. With respect to the human body at a particular location, mean radiant temperature is defined as the uniform temperature of an imaginary surrounding enclosure in which radiant transfer from the human body would equal the radiant heat transfer in the actual nonuniform enclosure (ASHRAE 2001). MRT is a calculated variable and cannot be directly measured. One calculation approach involves using a globe thermometer, which can be easily constructed using a hollow sphere (e.g., a Ping Pong ball) with a thermocouple or thermometer bulb at its center. Equation 1, for determining MR temperature from globe temperature, is as follows (ASHRAE, 2001):
I-P units:
- tr = mean radiant temperature, °F (°C)
tg = globe temperature, °F (°C)
Va = air velocity, fpm (m/s)
ta = air temperature, °F (°C)
D = globe diameter, ft (m)
e = globe emissivity (dimensionless)
Another calculation approach involves the geometry of the room relative to a specific point and uses Equation 2 (Egan, 1975):
I-P or SI units
tr = mean radiant temperature, °F (°C)
a = surface exposure angle (relative to the occupant)
in degrees DB air temperature by itself is usually not an adequate comfort indicator, especially in passively solar-heated or passively cooled spaces where radiant temperature or air motion may be more influential than air temperature.
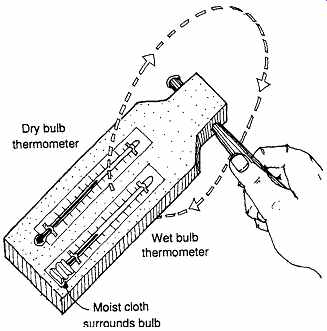
Fig. 6 Sling psychrometer and its usage. Air motion encourages evaporation
from the moist cloth, lowering the wet-bulb temperature below the surrounding
air temperature, whereas the dry-bulb temperature stays constant at the surrounding
air temperature. (At 100% RH, WB and DB temperatures will be equal.)
The comfort zone in Fig. 5 purports to apply to both genders, any age, and any national origin; research by ASHRAE supports such a view. High humidity is avoided (to avoid mold and mildew as well as discomfort), and air motion is assumed to be unnoticeable. Occupants of naturally ventilated buildings, however, seem to find comfortable a combination of higher temperature and RH than do occupants of sealed, air-conditioned buildings.
Figure 7 shows a much higher incidence of these warmer, more humid environments in Hawaiian naturally ventilated classrooms than in similar air-conditioned classrooms. Yet, the majority of students and teachers in these Hawaiian schools voted these conditions as acceptable. These observations were made in both hot and cool seasons (see Kwok, 1998).
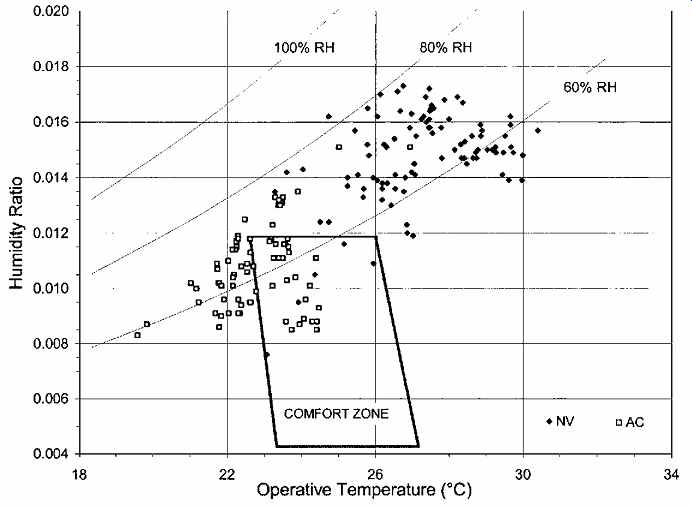
Fig. 7 Natural ventilation and comfort. Measured conditions compared to
the ASHRAE summer comfort zone for naturally ventilated (NV) and air-conditioned
(AC) classrooms in Hawaii. The majority of the occupants voted these conditions
acceptable. A higher temperature and humidity comfort zone for naturally ventilated
buildings is supported by studies such as this (Kwok, 1998). (Reprinted with
permission of the American Society of Heating, Refrigerating and Air-Conditioning
Engineers, Inc. from ASHRAE Transactions, 1998, Vol. 104, Number 1. Note that
the comfort zone shown herein has been modified to conform to ASHRAE Standard
55-2004.)
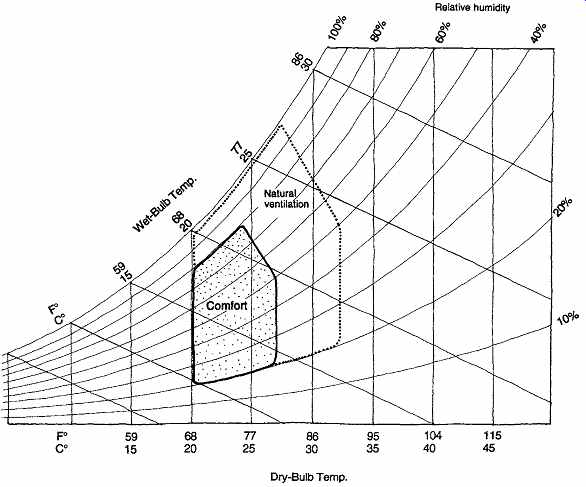
Fig. 8 Suggested boundaries of outdoor air temperature and humidity within
which indoor comfort can be provided by natural ventilation. Assumed air speed
is 2 m/s (4.5 mph). The higher limits for "hot-developing countries" assume
acclimatization by those cultures. (Based upon Givoni, 1998.)
Does long-term acclimatization influence the sensation of thermal comfort? Researchers disagree.
ASHRAE Standard 55 recognizes only two seasonal comfort zones, influenced by activity and clothing.
Givoni (1998) advocates a higher-temperature, higher-humidity limit for "hot-developing" countries (Fig. 8), based upon a combination of traditional and economic factors. In Fig. 8, an interior air speed of 2 m/s (about 5 mph) is assumed.
An adaptive model of comfort recognizes acclimatization's influence as well as personal actions to influence one's own comfort. ASHRAE Standard 55 recognizes that people can be comfortable in a wide range of temperatures and provides an optional method for determining acceptable thermal conditions for naturally conditioned spaces. Humphreys and Nicol (1998) elaborate on this approach, with occupant behaviors summarized in Table 3. They present a formula to determine the indoor com fort temperature, Tn, relative to an exponentially weighted running average of outdoor temperature, and applicable to free-running buildings (without mechanically-narrowly-controlled indoor temperatures):
Tn = 0.534 Trmo + 12.9 (°C) (eqn. 3)
...where Trmo is in °C and represents the mean outdoor air temperature during a period of hot weather.
Note that relative humidity is not included in this relationship. Using this equation, with Phoenix, Arizona's, average July-August temperature of 32.3°C (90.2°F) (to approximate Trmo, an exponentially weighted running average):
Tn = 0.534 (32.3) + 12.9 = 17.25 + 12.9 = 30.1°C (86.2°F)
Figure 5 specifies comfort zone boundaries for environments that meet specific operative temperature criteria, where the air speeds are not greater than 40 fpm (0.20 m/s), based upon specified clothing insulation values. Air speeds greater than 40 fpm (0.20 m/s) may be used to increase the upper operative temperature limit of the comfort zone in certain circumstances. For example, the borders of the summer comfort zone may be raised 1°F for each 30 fpm (1°C for each 0.275 m/s) increase in air motion up to a limit of 82.45°F at 160 fpm (28°C at 0.8 m/s). At this air speed, loose paper, hair, and other objects might start to be blown about (how ever, see Table 4).
Note: Optimum summer operative temperature is 76°F (24.4°C). For each 0.1 CLO decrease in clothing, an increase of 1°F (0.6°C) is allowed in the borders of the summer comfort zone.
The upper and lower borders for relative humidity are based upon less precise data, but in general, the lower limit seeks to avoid problems such as coughs, nosebleeds, static electricity, and dust mites from excessively dry air; the upper limit tries to keep skin wettedness within acceptable levels, as well as discourage the growth of mold and mildew.
Table 3 Adaptive Behavior for Thermal Comfort
Table 4 Indoor Air Velocity and Comfort
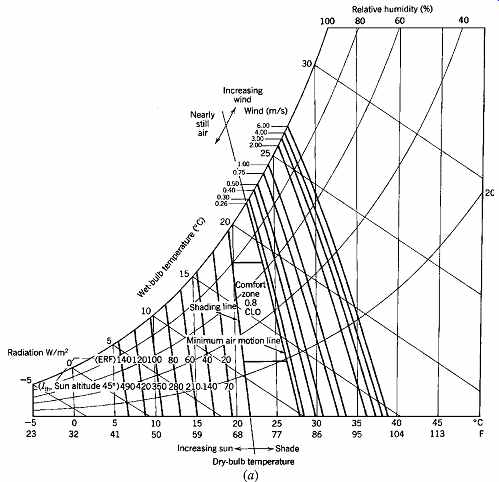
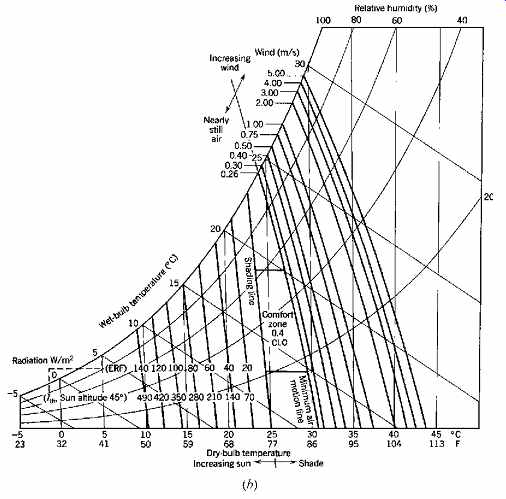
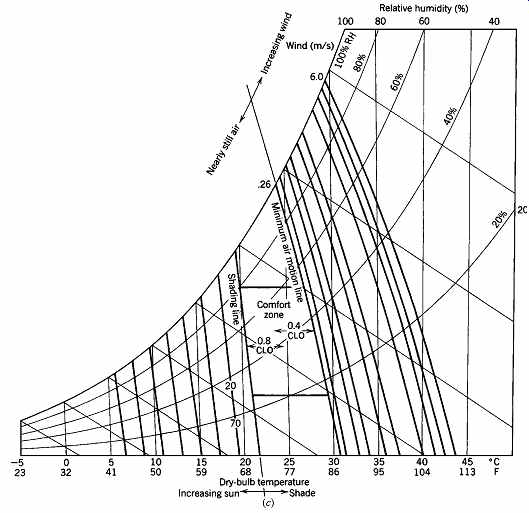
Fig. 9 Comfort zones that encourage passively heated and cooled buildings.
The "winter" (0.8 CLO) comfort zone (a) and the "summer" (0.4
CLO) comfort zone (b) are combined for the year-round zone shown in (c). (Based
upon Arens et al., 1980.)
(b) Passive Building Comfort Standards
A somewhat different approach to comfort standards has been proposed for buildings that take a passive approach to heating and cooling in areas where acceptable humidity can be maintained. In these buildings, direct sun might add significantly to body warming in winter; strong air currents might be expected as a part of summer body cooling.
These tend to be the kind of free-running buildings mentioned earlier as candidates for the adaptive model of comfort prediction.
Arens et al. (1980) demonstrated a wider range of comfort conditions and considerably more tolerance for summer air motion than ASHRAE (1995). A summary of these results is shown graphically in Fig. 9. Such graphs are called bioclimatic charts because of their interrelation of climate and human comfort factors. Where the users of buildings are expected to adjust to the wider temperature swings associated with passive buildings, these guidelines may be used. Some differences in the basic assumptions of Arens et al. from those of ASHRAE (1995) should be noted:
Activity: 1.3 MET (ASHRAE, 1.2 MET)
Winter: 0.8 CLO (ASHRAE, 1.0 CLO)
Summer: 0.4 CLO (ASHRAE, 0.5 CLO)
Note particularly that rather than operative temperature, ordinary air temperature (DB temperature) is used in Fig. 9. Added radiant heat for conditions below the shading line can be utilized to extend the comfort zone to lower temperatures; added air motion above the nearly still air line can extend the comfort zone to higher temperatures.
Radiant heat to be added to a lower-extended com fort zone is shown in Fig. 9 using two quantities: The effective radiant field (ERF) is a measure of the net radiant heat flux to the body from all surfaces at temperatures other than air temperature. A more convenient quantity for designers may be the total solar radiation (or insolation) on a horizontal surface, termed Ith.
Insolation values are more readily available, and the added-radiation lines of Fig. 9 represent Ith converted to its approximate radiant impact on a human body's surface area when the sun is at an altitude of 45°. Arens et al. (1980) give further details on the effects of solar radiation on comfort at other sun altitudes, activity levels, and clothing combinations.
Added air motion is shown in Fig. 9 for quite a wide range of velocities. Table 4 indicates that people easily tolerate air motion outdoors up to about 600 fpm (3 m/s), but indoor studies have indicated that about 400 fpm (2 m/s) is the maxi mum tolerable air speed from overhead fans.
Caution is still advised when relative humidity is above 70% or below 20% for reasons cited earlier.
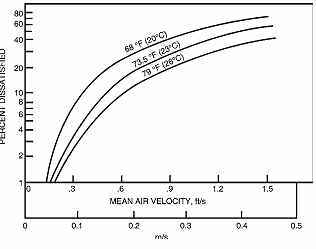
Fig. 10 Percentage of people dissatisfied as a function of mean air velocity.
The warmer the air, the greater the tolerance. (Reprinted with permission of
the American Society of Heating, Refrigerating and Air-Conditioning Engineers,
Inc., from the 1997 ASHRAE Handbook-Fundamentals.)
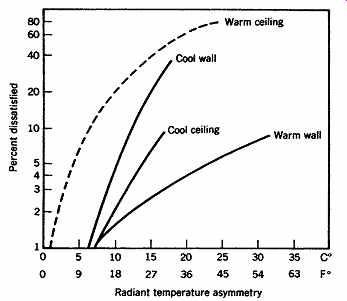
Fig. 11 Percentage of people expressing discomfort due to asymmetric radiation.
A warmer ceiling produces the highest discomfort; a warmer wall, the least
discomfort. (Reprinted with permission of the American Society of Heating,
Refrigerating and Air-Conditioning Engineers, Inc., from the 1997 ASHRAE Handbook-Fundamentals.)
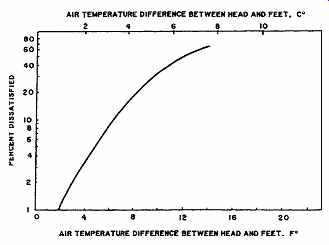
Fig. 12 Percentage of people dissatisfied as a function of the vertical
air temperature difference between the head (higher temperature) and ankles
(lower temperature). A cold floor proved uncomfortable.
(c) Localized Comfort
How can comfort be ensured at each workstation in an office or wherever people spend a lot of time? The location of heating, cooling, and ventilating components is an important detail. The human body is most affected by the thermal environment in its thermally sensitive places. Although we sweat and are sensitive to heat or cold over nearly all of our skin surface, we are most thermally sensitive in these places:
Heat receptors: fingertips, nose, elbows
Cold receptors: upper lip, nose, chin, chest, fingers
So, on a hot, humid day, cool air moving across the face is a particularly strong promise of comfort, whereas on a cold day, a burst of heat (such as radiant heat from a window, a heater, or a cup of coffee) to the face and fingers is quickly effective.
Regarding our sense of touch: our fingertips are most sensitive to the rate at which heat is being conducted to colder objects or from hotter objects.
The temperature of our skin at the fingertips under ordinary conditions is in the high 80s°F (high 20s°C), so our sense of touch works against many passively heated surfaces in winter, which feel cool even though they are warmer than room air temperature. These surfaces are made of materials that conduct heat rapidly so that they can soak up solar radiation without overheating the room.
This high conductivity makes them eager to accept human warmth as well, and persuades us as we touch them that they are cooler than, in fact, they are. Anyone who has walked barefoot from a rug to an unheated tile floor will sense that the tile is colder, even when both have exactly the same surface temperature. This same characteristic works for passively cooled surfaces in summer.
Excessive air motion is called a draft and results in an undesirable local cooling of the body. It is a particularly serious threat in winter, yet summer drafts from very cool conditioned air are also bothersome. Figure 10 shows the percentage of people dissatisfied due to a perceptible draft on their head, neck, shoulders, and back. Again, this applies to sedentary people wearing normal indoor clothing.
Note the influence of air temperature: the lower the temperature, the higher the dissatisfaction. Many air-conditioning systems deliver summer supply air at temperatures as low as 55°F (13°C), well below the lowest temperature shown here. The standard summer 50 fpm (0.25 m/s) air speed at such sup ply air temperatures seems to threaten more than 40% dissatisfaction from drafts. However, ceiling fans with the same air speed, for comfort at higher temperatures such as 80°F (27°C), should cause less than 15% dissatisfaction.
Another comfort factor is radiant asymmetry, the difference between the temperatures of two opposite surfaces as experienced by a body seated between them when one of these surfaces is markedly different in temperature from all other surfaces within a space. Figure 11 shows that the greatest dissatisfaction arises from "warm ceilings" (typical of radiantly heated ceilings in winter)-almost half of the experimental subjects experienced discomfort with ceilings 27°F (15°C) warmer than a space's average temperature. Less serious were "cool walls" (typical of a cold window in winter). Less than 10% dissatisfaction resulted from "cool ceilings" (such as radiant cooling panels in summer) and even less from "warm walls" (typical of a sunny window in summer or a passively heated mass wall in winter).
Because warm air is less dense than cold air, it rises; therefore, in most building spaces, air temperature is somewhat higher at the ceiling than at the floor, regardless of the season. Figure 12 shows experimental results of dissatisfaction with a vertical air temperature difference between the head at 43 in. (1.1 m) and the feet at 4 in. (0.1 m). (When the head level was cooler than the floor, much greater temperature differences were tolerated.)
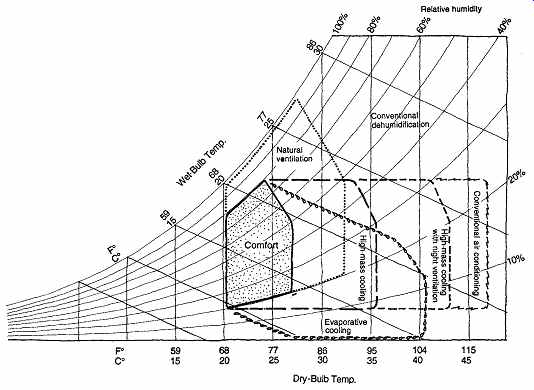
Fig. 13 Passive cooling design strategies by climate. After plotting the
outdoor climate data on this chart, consider how that information would affect
a design strategy.
Table 5 Normal Data from Annual Summary of Local Climatological Data for Dodge City, Kansas
3. DESIGN STRATEGIES FOR COOLING
The chart in Fig. 13 is a guide to various approaches to passive cooling in temperate climates. It is based on the building bioclimatic chart developed by Milne and Givoni (1979). It helps to assess the suitability of four approaches to passive cooling under summer conditions. Average monthly climate data (as in Table 5) are now available from software and various websites. Such climate data can be plotted on this chart. If they do not exceed the "boundaries" of a strategy zone, then a match is indicated between the climate and that strategy. Although the edges of each strategy zone are drawn as lines, these boundaries are more broad and vague than the lines suggest. When a climate surpasses the boundaries of all four strategy zones, conventional air conditioning is almost certainly desirable. The similarity between Figs. 9 and 13 is evident: the comfort zones include somewhat warmer conditions for naturally ventilated buildings.
To plot average monthly conditions for a climate on this strategy chart, assemble information such as that shown in Table 5. This is available for every climatological station maintained by the National Oceanic and Atmospheric Administration (NOAA) of the U.S. Department of Commerce.
These climate summaries, often called LCDs (Local Climate Data), are available from the National Climatic Data Center (Federal Building, Asheville, NC 28801). Many libraries also carry such summaries in publications such as Climates of the States.
In addition to a typical hot summer day, it is useful to check for the design condition, that statistically relevant condition for which engineers would design a building's mechanical cooling equipment.
The design condition shows the climate near its worst, while avoiding the freakish conditions of extreme temperatures listed in the NOAA data.
Summer (and winter) design data are available using Google (along with discussion of the nature of the data).
EXAMPLE 1
Plot the typical day of the hottest month for Dodge City, Kansas.
SOLUTION
By inspection of Table 5, the hottest month is July, but August is close and sun angles are lower (more gain through windows). To chart the typical August day, find the approximate RH for the coldest and hottest hours. Because RH is listed only at four times, first select the highest RH, occurring here at 6:00 A.M.: this will coincide approximately with the coldest hour. Thus, one end of the linear climate plot for August in Dodge City will be at the combi nation of 80% RH and 65.7°F (18.7°C). The other end of the plot will be at the lowest RH and the hottest hour, in this case at 6:00 P.M., a combination of 46% RH and 90.4°F (32.4°C). The line between these points is shown in Fig. 14. From Fig. 14 one passive cooling strategy--high mass with night ventilation--appears clearly adequate to meet the needs of the typical August day in Dodge City. (Using this strategy, the low temperature end of the line is also important and should be below the comfort zone for best results.) Another strategy, high mass, appears just barely adequate. Two other strategies, natural ventilation and evaporative cooling, appear inadequate because the highest temperature/lowest RH combination falls outside their boundaries--slightly so for natural ventilation, but greatly so for evaporation.
Using design climate data corresponding to the values in Table 5, the summer DB and mean coincident WB temperature is 97/69°F (36.1°C/20.6°C); this combination is shown as a circle around the point in Fig. 14. The 97°F (36.1°C) DB tempera ture is plotted on the corresponding vertical line; the 69°F (20.6°C) WB temperature is found by first locating the 69°F (20.6°C) DB vertical line and following that line up to 100% RH, where 69°F (20.6°C) DB and WB are coincident. Then follow downward to the right along the constant WB line to its intersection with 97°F (36.1°C) DB.
The design condition point falls just outside the zone of high-mass cooling and just within the zone of evaporative cooling. Because the design condition falls well within the zone of high mass with night ventilation, this strategy is thus confirmed as clearly the best of the passive cooling strategies for Dodge City.
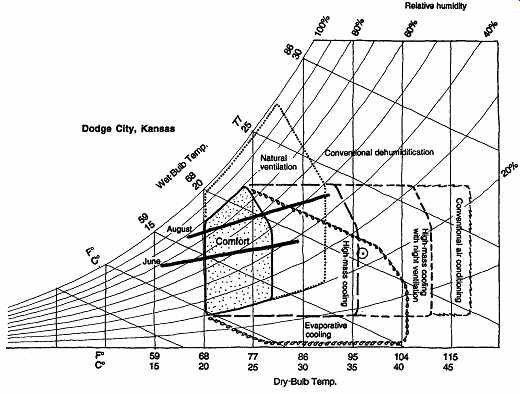
Fig. 14 Hot-month daily ranges and the summer design condition for Dodge
City, Kansas, superimposed on the design strategy chart of Fig. 13.
(a) Natural Ventilation Cooling
This is the most obvious strategy suggested by the comfort charts presented earlier, in which higher air temperatures were offset by increased air motion. It may be the only passive strategy avail able in humid, hot climates in which temperatures are only slightly lower by night than by day. Buildings should be very open to breezes while simultaneously closed to direct sun. They may be thermally lightweight as well, because night air is not cool enough to remove much stored daytime heat. Very high humidity may be avoided only by sealing and air-conditioning buildings.
Natural ventilation has two variations: cross ventilation and stack ventilation. Cross-ventilation is driven by wind and is accomplished with windows. It relies upon rather narrow plans with large ventilation openings on either side. Thus, it is naturally compatible with daylighting. Stack ventilation depends upon very low openings to admit outside air and very high openings to exhaust air; it is driven by the principle that hot air rises. Stack ventilation is generally weaker than cross-ventilation-except when there is no wind at all. Design guidelines for sizing apertures for ventilation are found in Section 8.
(b) High-Mass Cooling
This strategy is for warm, dry summers, when the extremes of hot days are tempered by the still-cool thermal mass of a building. Cool nights then slowly drain away the heat that such mass accumulates during the day. The thermal mass can be in floors, walls, or roofs but will need a sink to which it can reject its heat by night. The roof has the advantage of radiating to the cold night sky, but it should be protected from exposure to sun by day. The masonry courtyard-type buildings of the Mediterranean are indigenous examples of this passive cooling strategy; their courtyard floors and roofs can be protected with movable shading devices (toldos) by day, then opened to night-sky radiation.
Roof ponds are a form of high-mass cooling for one- and two-story buildings. Because they require only the roof to be massive, they allow for consider able design freedom in walls and fenestration. Where cooling is the only objective, this approach uses water that is stored between the metal ceiling and the roof insulation; by night, the water is pumped (and/or sprayed) over the exposed roof surface and allowed to trickle back through the insulation to the storage pond. At lower latitudes (with high winter sun altitudes), roof ponds can be used for passive solar heating as well. This strategy uses sliding panels of insulation over bags of water; the panels slide open on winter days to collect sun, and open on summer nights to radiate heat to the sky. A design guideline sizing procedure is found in Section 8.
Another variation on high-mass cooling depends upon earth contact. The earth acts as a heat sink, keeping walls and floors (even roofs when earth-covered) cool. However, if the earth is allowed to continue to act as a heat sink in winter, heating needs could be greatly increased. Thus, a strategy for summer contact and winter isolation might be appropriate.
(c) High-Mass Cooling with Night Ventilation
This hot-dry summer design strategy must use out side air at sub-comfortable nighttime temperatures to flush away heat stored during the daytime. The fewer the sub-comfortable night hours, the greater the area of thermally massive surface that must be provided to store the day's heat. Also, because there are more hours of daylight and fewer of nighttime, the ventilation must occur quickly and thoroughly, probably using fans. (Nightly wind velocities are typically lower than daytime velocities, because summer wind is often driven by regional solar over heating of the ground.) The building switches from a thermally closed condition by day (to exclude sun and hot outdoor air) to an open condition at night (to allow ventilation to cool the mass). Note: Nighttime temperatures must be cooler than the comfort zone temperature if this strategy is to be effective. Figure 15 shows the need to inspect both ends of the typical day's plot for this strategy.
This cooling strategy is highly compatible with passive solar heating strategies that rely on large areas of thermal mass, such as direct gain (Section 4a). It is suitable for large, high buildings, particularly those that have concrete (thermally massive) structural systems. A design guideline sizing procedure is found in Section 8.
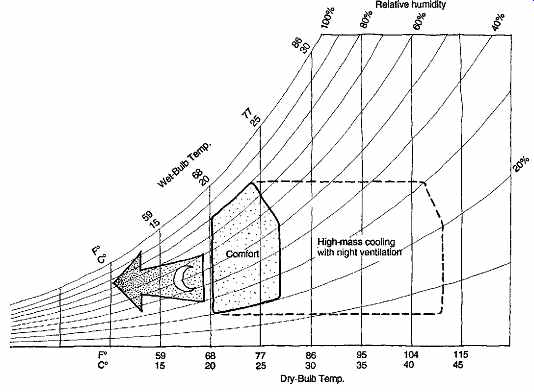
Fig. 15 Strategy chart segment for night ventilation of thermal mass. This
strategy is most successful when cool nighttime temperatures are available,
preferably below comfort zone temperatures for several hours.
(d) Evaporative Cooling
This design strategy relies on the principle that when moisture is added to air, relative humidity increases while dry-bulb temperature decreases.
(On the bioclimatic chart, this pattern exactly follows the constant wet-bulb line, upward and to the left.) In conditions that are more uncomfortably dry than uncomfortably hot, higher humidity is gladly exchanged for lower air temperature. However, large quantities of both water and outdoor air are needed; fan-driven evaporative coolers are the most common way to provide this kind of cooling.
Evaporative cooling imposes few constraints on designers because the equipment resembles conventional HVAC systems. Rather high indoor air velocities and their associated sounds are typical of these systems, and the aroma of the wetted material of the cooler is often noticeable. The coolest air will be in the vicinity of the air inlet to the space, the warmest air at the outlet from the space.
Design guideline sizing procedures are found in Section 8 for fan-driven coolers and for passive cool-towers. Indirect evaporative cooling, involving mechanical equipment, is first discussed in Section 5.
4. DESIGN STRATEGIES FOR HEATING
Figure 16 indicates how greatly solar space heating may contribute to a building in the winter months. To use these charts, refer to Table C.15.
For your location, find the average January ambient (DB) air temperature, called TA, and the average January daily solar radiation on a vertical south facing surface, called VS. On each chart, find these two data points to determine the approximate percentage contribution that solar energy can make to your building's winter seasonal fuel needs. In Fig. 16a, these points of TA and VS are plotted for seven North American cities. Sunny and cold Denver, Colorado, contrasts sharply with cloudy and cool Portland, Oregon. Yet, the subsequent charts show that even in Portland, solar energy can con tribute to space heating.
The remainder of Fig. 16 compares two building envelope types with three common solar heating strategies. The left column (Fig. 16b, d, f) assumes a building with insulation at code required minimums and some south-facing glass (unshaded in winter). For this modestly solar building type, the seasonal fuel bill will be reduced, but rarely more than 40%, by using solar energy. The right column (Fig. 16c, e, g) assumes a building that exceeds minimum insulation requirements and is designed with much greater areas of south facing glass unshaded in winter. For this seriously solar building type, the seasonal fuel bill will be reduced by about twice as much as its modest counterpart.
The three solar heating strategies are direct gain (let sunlight into the space, where it warms exposed thermally massive surfaces), indirect gain (sun strikes the thermal mass first and is then passed only as heat to the space behind), and isolated gain (a sunspace or greenhouse heated greatly by the sun that then passes some of its heat to the space behind). Direct-gain systems carry the symbol DG; indirect-gain systems, TW (for Trombe wall); and isolated-gain systems, SS (for sunspace). All the systems in this figure assume double-glazed windows (and for the direct and indirect ones, low-e, argon-filled windows), but none uses night insulation over windows. The direct gain is system type DGB2, the indirect gain is a vented TWD2, and the isolated gain is SSE1.
(a) Direct Gain
Almost any building with some south-facing glass could claim to be a direct-gain building. The sun is admitted to the space to be heated, striking furnishings and room surfaces. In a well-designed direct gain space, there are ample thermally massive surfaces (such as concrete slab; concrete block; or brick, quarry, or ceramic tile) that directly receive much of this incoming sun. Such massive surfaces should have at least three times the area of south facing glass in order to keep the space from over heating in sunny hours. The mass should be thick enough, typically at least 4 in. (100 mm), to absorb and later reradiate a winter day's dosage of direct sun. In Section 8 and Appendix H, variations on direct-gain approaches involve glazing types, relative mass areas and thickness, and whether night insulation is used over windows.
Direct gain is popular because of its simplicity and its ample daylight and view to the south.
Relative to the other passive solar approaches, it has problems of glare, overheating on sunny days, large radiant heat losses to glass areas by night (and thus a large diurnal difference in interior temperature), and fading of furnishings in direct sunlight. This winter heating approach is well matched with the summer cooling strategy of night ventilation of mass; both systems depend on large areas of internal exposed thermal mass, so such an investment pays off in both winter and summer.
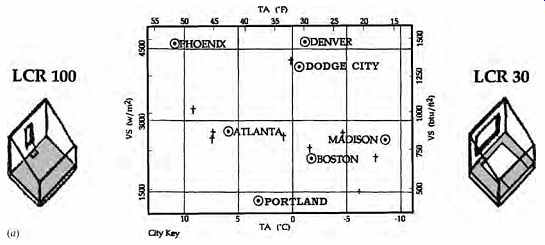
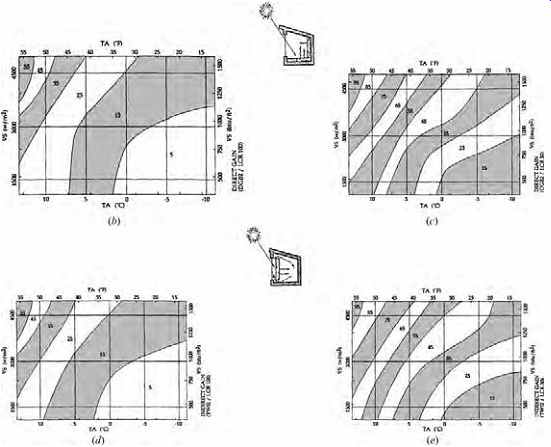
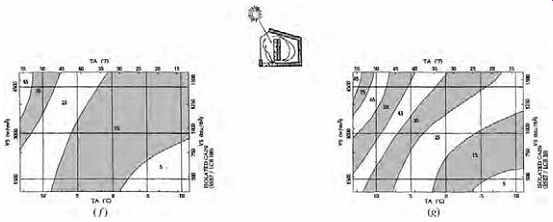
Fig. 16 Early assessment of passive solar heating potential. (a) From Tables
C.19 and C.20, the January TA (average air temperature) and January VS (daily
solar radiation on a vertical surface) are plotted for Atlanta, Georgia; Boston,
Massachusetts; Denver, Colorado; Dodge City, Kansas; Madison, Wisconsin; Phoenix,
Arizona; and Portland, Oregon. The Solar Savings Fraction (SSF), the percentage
reduction in heating fuel achieved by a passive solar design, is approximated
for modestly solar "LCR 100" (smaller south windows, moderately well
insulated) and seriously solar "LCR 30" (larger south windows, very
well insulated) buildings. ( Indicates where SSF is approximately 6% higher
than that shown on the graph for these locations: in California: Fresno, Mt.
Shasta, Sacramento, and San Francisco; in Idaho: Boise and Pocatello; in Montana:
Helena and Missoula; and in Nevada: Reno.) (b) Direct-gain systems in modestly
solar and (c) seriously solar buildings (LCR 30). (d) Indirect-gain systems
in modestly solar and (e) seriously solar buildings. (f) Isolated gain systems
in modestly solar and (g) seriously solar buildings.
(b) Indirect Gain
This is the passive solar approach encountered least often, perhaps because a sheet of glass covering an opaque wall seems such a denial of "window." The mass wall behind the glass is usually 8 to 12 in. (200 to 300 mm) thick, and should be of a dense and highly conductive material such as standard weight concrete or dense brick. Water in containers is also an option. An air space between the glass and the mass allows for the option to "vent" the mass wall, where cool air from the heated space behind the wall enters at the bottom, rises with solar heating, and then exits into the space behind near the ceiling. Sometimes this air space is made wide enough to admit a person for cleaning the inside surface of the glass, but operable casement or awning-type glazings are other cleanable options. The back surface of the mass (facing the heated space) should be kept clear of hangings or large furniture, to facilitate radiant heat transfer to the space. In Section 8 , variations on indirect-gain approaches involve mass characteristics (water or masonry), thickness, and surface treatments; whether masonry walls are vented; glazing types; and whether night insulation is used behind the glazing.
Indirect gain is less popular than direct gain because it admits much less daylight and lacks a view to the south. Yet, relative to the other passive solar approaches, it has advantages of less glare, significantly less overheating on sunny days, and no fading of furnishings in direct sunlight. Another advantage is its large radiant heat contributions in the evening after sunny days. Many applications of indirect gain incorporate a smaller area of direct gain (window) within the larger indirect-gain wall surface.
(c) Isolated Gain
This is a popular passive solar approach because it provides a uniquely sunny habitable space, alternately called a sunspace, greenhouse, sun room, or winter garden. This space experiences great variations in temperature-hot in the afternoon, cold before dawn-in order that the space behind it can be kept reasonably comfortable with solar heating delivered as needed. The sunspace usually has both south-facing vertical glazing and inclined glazing, increasing insolation in both winter and summer.
In Section 8, variations on isolated-gain approaches involve configurations of the glazings; whether the sunspace is surrounded by the building or is added on; whether the common wall between sunspace and building is masonry or insulated frame; whether the sunspace's end walls (facing east and west) are glazed or insulated; glazing types; and whether night insulation is used behind the glazing.
Section 8 presents much more detail on building insulation standards, south-facing window areas, thermal mass, and options for movable window insulation. This introduction to passive solar heating design is intended to help the designer find combinations of daylighting, passive cooling, and passive solar heating design approaches that are feasible in a given climate.
5. COMBINING STRATEGIES
Renewable sources of on-site energy for lighting, heating, and cooling allow a building to function with less need for imported energy sources. As building designs are shaped by the use of on-site sources, they become more regional in appearance.
This works against the one-design-fits-all approach common to chain retailing (such as video stores or fast-food outlets), but works for the subtle integration of a building into its regional climate and culture while reducing the economic and environ mental costs of imported energy.
(a) Daylighting
This may be the most obvious and commonly used of all on-site energy sources. Two approaches are side-lighting, using windows in walls, and top-lighting, using skylights in roofs. A hybrid approach is the clerestory window in very high walls; depending upon the clerestory window's relation to the floor plan, it could be considered either side-lighting or top-lighting.
Side-lighting not only admits light but allows for a view of the exterior (and of the interior, especially at night). Side-lighting varies substantially by orientation and season, and direct sun can pour large quantities of heat through unshaded windows.
With windows that face east and west, daylighting problems can occur due to the low sun altitudes in morning and evening that result in glare and unwanted summer heat gain.
Toplighting admits more light per unit area than does sidelighting, as skylights are directly exposed to the bright sky dome as well as direct sun light. Toplighting less often results in glare problems because the light source is high in the space, unlike a sunny window that is in one's field of view. However, direct sun passing through a clear skylight may strike interior surfaces, with consequent glare and fading. Moreover, unshaded sky lights (more than unshaded windows) are exposed to summer sun by day and to the cold winter sky.
Although more efficient as admitters of light, they can represent a significant thermal penalty. There fore, seasonal controls on skylights are even more important than on windows. Design guidelines for the sizing of windows and skylights are found in Section 14.
(b) Daylighting, Cooling, and Heating
Although the relationships among these three aspects of environmental control are quite complex, in general the decision to extensively daylight a building tends to decrease its need for electricity and cooling and increase its need for heating. This is due to the influence of the large glass areas associated with daylighting. In summer, properly shaded daylighting openings contribute less heat gain than the electric lights that the daylight is replacing. This reduces the need for both electricity and cooling. In winter, some solar gain through daylight openings assists with heating (especially with south-facing windows), but the daylight still replaces electric lights that would otherwise be additional sources of heat. Thus, compared to a conventional building of the same size and function, the daylit building is likely to use more heating energy (unless passive solar heating is emphasized), less electricity for lighting, and less cooling energy.
The matrix of design strategies in Fig. 17 illustrates some opportunities for a simple one space building across a range of on-site energy sources. Ventilative cooling strategies depend upon the air as a heat sink; evaporative/radiative cooling strategies depend upon both sky and air as heat sinks; earth coupling cooling strategies depend upon the earth as a heat sink. For a more extensive treatment of combined strategies by region for daylighting, cooling, and heating, see Lechner (2008) for 17 U.S. climate zones with bioclimatic charts of monthly conditions, vernacular design approaches, and recommended climate design priorities.
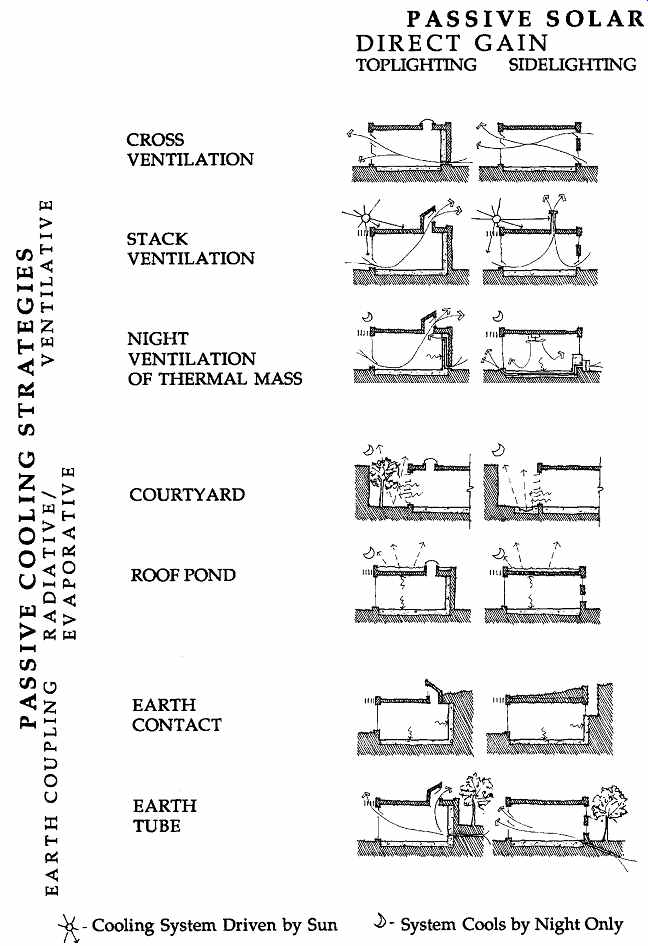
Fig. 17 Combining daylight, passive cooling, and passive solar heating opportunities.
These schematic sections of simple one-cell buildings remind designers of the
potential for site-based, renewable resources and how they might interact.
(Sharon Shoshani and Alan Rutherford, University of Oregon class project.)
6. VISUAL AND ACOUSTICAL COMFORT
The state of being comfortable includes several environmental qualities-thermal, visual, and acoustic conditions that contribute to our health and well being. As discussed in this section, thermal comfort is represented by a fairly unified theory in which the interrelationships of environmental and personal variables are defined and quantified. Visual and acoustical comfort variables are not so well developed or researched. The visual and acoustical com fort pictures are complex: If one variable changes, the impact on other variables is unclear and there are no guarantees of comfort. For example, if daylight and electric light are integrated, is glare necessarily eliminated by adequate illuminance and color rendering? Visual comfort can also mean pro viding a connection to the outdoors and visual stimulation through the use of view windows. Acoustic comfort in a classroom may mean that teachers and students can hear one another, and external noises are prevented from reaching the classroom; or class rooms may simply have good reverberation time so that students can hear the teacher.
This section focused upon thermal comfort because of the highly developed state of thermal comfort information and standards. A focus on visual and acoustical comfort is no less important to building design, but the information available to the designer is not as well integrated or standardized. The designer can begin to understand the complexities of these issues by examining issues individually and then integrating concerns via the design process.
References and Resources
Arens, E., R. Gonzalez, L. Berglund, P. McNall, and L. Zeren. 1980. "A New Bioclimatic Chart for Passive Solar Design," in Proceedings of the Fifth National Passive Solar Conference, Vol. 5.2, pp. 1202-1206. American Section of the Inter national Solar Energy Society. Boulder, CO.
ASHRAE. 1995. ANSI/ASHRAE Standard 55a-1995, addendum to ANSI/ASHRAE 55-1992, Thermal Environmental Conditions for Human Occupancy.
American Society of Heating, Refrigerating and Air-Conditioning Engineers. Atlanta, GA.
ASHRAE. 1997. Handbook-Fundamentals. American Society of Heating, Refrigerating and Air-Conditioning Engineers. Atlanta, GA.
ASHRAE. 2001. Handbook-Fundamentals. American Society of Heating, Refrigerating and Air-Conditioning Engineers. Atlanta, GA.
ASHRAE. 2004. ANSI/ASHRAE Standard 55 2004, Thermal Environmental Conditions for Human Occupancy. American Society of Heating, Refrigerating and Air-Conditioning Engineers. Atlanta, GA.
Egan, M. D. 1975. Concepts in Thermal Comfort. Prentice-Hall. Englewood Cliffs, NJ.
Givoni, B. 1998. Climate Considerations in Building and Urban Design. Van Nostrand Reinhold. New York.
Heschong, L. 1979. Thermal Delight in Architecture.
The MIT Press. Cambridge, MA.
Humphreys, M. and J. F. Nicol. 1998. "Under standing the Adaptive Approach to Thermal Comfort," in ASHRAE Transactions, Vol. 104, Number 1.
Kwok, A. 1998. "Thermal Comfort in Tropical Classrooms," in ASHRAE Transactions, Vol. 104, Number 1.
Lechner, N. 2008. Heating, Cooling, Lighting: Design Methods for Architects (2nd ed.). John Wiley & Sons. New York.
Milne, M. and B. Givoni, 1979. "Architectural Design Based on Climate," in Energy Conservation Through Building Design, D. Watson (ed.). McGraw-Hill, New York.
National Climatic Data Center, U.S. National Oceanic and Atmospheric Administration
Olgyay, V. 1963. Design with Climate: Bioclimatic Approach to Architectural Regionalism. Princeton University Press. Princeton, NJ.
Thermal Comfort Index Calculator ( Macquarie University)
Prev. | Next
Home Similar
articles top
of page