AMAZON multi-meters discounts AMAZON oscilloscope discounts
Sections 1 through 5 provide some preparation for design: a perspective on energy, water, and material resources; an understanding of human comfort and indoor air quality; an analysis of the climate resources available on site; a list of the general design strategies appropriate to various climates; a discussion of the basics of heat transfer calculations; and some attention to requirements for the components of the building envelope. Hence, we now know much about the variables outside of a building, the desired conditions inside, and the individual components of a building's skin. In this Section, all these variables are integrated into the process of designing for heating and cooling with the important related factor of daylighting. The design of mechanical support systems is introduced in Section 9.
The information in this Section is organized from the general to the particular. It also serves two distinct kinds of buildings-buildings using on-site energy resources and more conventional buildings using imported energy.
1. ORGANIZING THE PROBLEM
How should the building envelope respond to the sometimes conflicting needs for heating, cooling, and daylighting? Heating and cooling design strategies were related to climate in Section 4, where it became evident that internal heat gains can shift the appropriate design strategies for a building toward cooling, perhaps eliminating heating needs entirely. Typically, much of this internal heat is pro vided by electric lighting. Daylighting can replace electric lighting for most of the typical working day in most building types-if the building is designed to allow daylight to reach most of the interior.
(a) Fenestration
Codes and standards typically prescribe a relation ship between floor area and fenestration area (residential buildings) or total wall area and fenestration area (nonresidential buildings). These prescriptions assume that a building will be designed convention ally, that is, to rely on imported energy for lighting, heating, and cooling. Thus, prescribed areas of fenestration tend to be rather small. If a designer wishes to rely on daylighting to a greater extent, then some proof of benefit will be needed.
Daylighting is accompanied by large glass areas, which increase a building's heating needs in winter; yet in such buildings, less heat from electric lighting is available to fill those needs. Another complication is that adequate daylight requires much larger glass areas under dim winter skies than under bright summer skies. If the glass area is sized for winter daylighting, then excessive daylight---and, along with it, excessive heat--might be admitted in summer. With proper controls, day lighting can reduce summer cooling loads, relative to electric lighting, but it will usually increase winter heating loads. Where passive solar heating or surplus heat from another source is readily avail able, this trade-off is attractive.
One of the earliest and most difficult questions for the designer is how much fenestration is optimum for a building. Some of the major energy end uses in buildings are: 30% for space heating, 11% for space cooling and ventilation, and 14% for electric lighting. By building type and location, however, this proportion of energy use can change substantially. Daylighting and the related square footage of windows are considered first because they so largely determine whether space heating or space cooling will be the dominant need within the building.
(b) Building Form
At its simplest, form can be reduced to questions of tall or short, thick or thin. FIG. 1 compares these form variations to their impacts on heating, cooling, and daylighting solutions. Thicker, taller buildings have more floor space away from climate influences; being electrically lit rather than daylit, they generate heat and need cooling all year. These buildings are called internal load dominated (ILD). In contrast, thinner buildings-in which nearly all spaces have an exterior wall-need heating in cold weather and cooling in hot weather; electric lighting by day is largely unnecessary. These buildings are called skin load dominated (SLD).
The ultimate choice of building form is determined by a combination of design issues; the energy use issue can help in the selection process. Once the building form has been chosen, the functions can be distributed according to typical architectural criteria, including thermal zoning considerations.
In the selection of a building form, some particularly important questions accompany each energy use. Because the question of daylighting versus electric lighting frequently is so influential in deter mining whether heating or cooling will be the dominant concern, we begin with daylighting.
DAYLIGHTING ISSUES
1. What will be the relative emphasis on sidelighting (characterized by uneven distribution and glare in the visual field but little glare on horizontal surfaces) and top-lighting (the reverse characteristics)?
2. What role will direct sun play in daylighting? In winter, can solar heat without glare be admitted?
3. How can seasonal adjustments be made in the size of daylight openings?
4. To what extent will daily changes in daylighting control be necessary?
5. How can adequate daylight be admitted in an even way, such that unwelcome dark-appearing places are avoided?
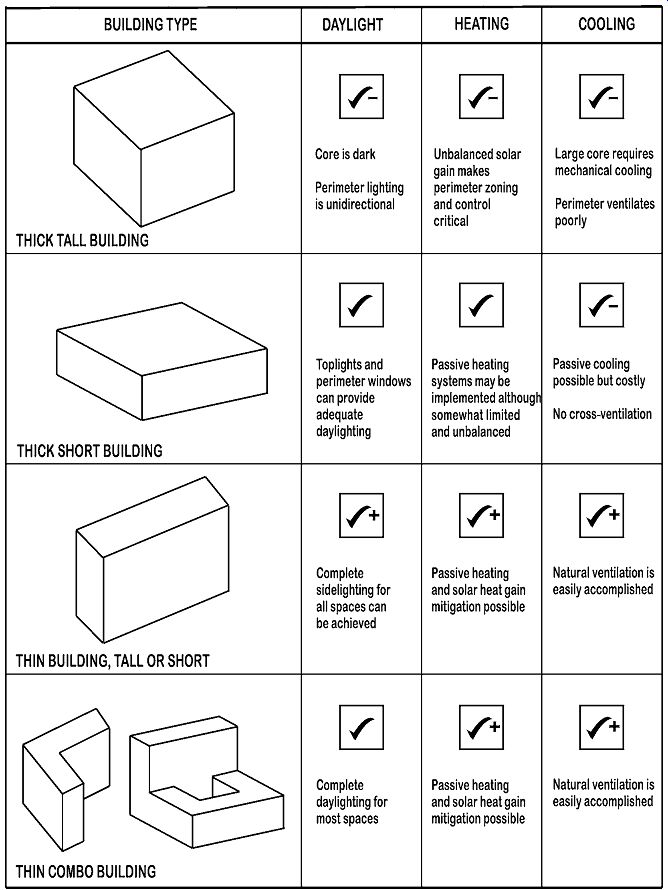
FIG. 1--The effect of building form on environmental control strategies.
The illustration shows how building layout affects cooling, daylighting, and
heating opportunities.
HEATING ISSUES
1. Can the sun be used to heat spaces? If so, how will south-wall design be affected?
2. How can openings in walls facing other directions be kept to a minimum without daylight being shut out? Where such openings are desirable, how low a fenestration U-factor can be justified?
3. What role will direct sun through south glass or skylights play in daylighting?
4. How can daylight be admitted but the chilling effects of large, cold glass surfaces be minimized?
5. How can incoming fresh air be warmed before it chills the people sitting near the fresh air opening?
6. Is there surplus heat elsewhere in the building that can be used to help warm perimeter spaces?
COOLING ISSUES
1. Will the strategy be to open the building to breeze or close the building for cooling retention, or to use a combination of these alternatives (open by night, closed by day)?
2. How can direct sun be kept out of the building? Can east and west windows be minimized and adequate daylight still be provided?
3. How can adequate daylight be admitted for winter conditions without overlighting (and thus overheating) for summer conditions?
4. When can cooling be provided by outdoor air rather than by a refrigeration cycle?
5. Can the operation of refrigeration machinery be concentrated during the coldest (nighttime) hours, when electric power is cheapest?
6. How can incoming fresh air be cooled before it warms the people sitting near the fresh air opening?
7. Can the structure of the building be used to absorb heat by day, then be flushed with night air in climates with cool nights?
(c) Building Envelope
The next design step involves relating the climate to the design of the building's skin. Each skin element provides an opportunity for thermal and luminous exchange between inside and out side; heating, cooling, ventilating, and daylighting devices can be mixed as needed. FIG. 2 shows some of the most common of these devices for varying orientations. Sections in this Section give numerical criteria for sizing these skin elements, with an emphasis on the use of on-site, renewable energy resources. These criteria may conflict with the size relationships that may be prescribed by codes and standards for conventional buildings.
An example of how lighting, heating, and cooling considerations can combine with other criteria (structural and acoustic, in this example) is shown in FIG. 3. These design diagrams explore opportunities in an office building in a cool-winter, dry summer climate; the actual resulting building is shown in FIG. 6.
2. ZONING
Before calculating winter heat loss and summer heat gain, zoning should be considered. Dividing the calculations into zones facilitates later decisions about sizes of equipment as well as fenestration and areas of thermal mass. The thermal and luminous zoning of a building recognizes that different envelopes and support systems may be required around and within the building. The more carefully zoning is considered in these early design stages, the better will be the lighting and thermal performance and the lower will be the annual energy consumption. (Also, the less likely it will be that all sides of a building will have an identical appearance.) Zoning is most often influenced by the following factors:
1. Function. Particularly important because of the variations in internal heat gains between functions, function may also influence the zonal organization of a building, as in FIG. 4. Comfort conditions may vary considerably between functions; air temperatures can be lower for a strenuous activity than for a sedentary activity, or heat tolerance may be greater for some activities (restaurant kitchens) than for others. Some functions thrive in daylight; others shun it. Some functions adversely affect the IAQ of other functions.
2. Schedule. Closely related to function, scheduling can influence both the envelope and the support system. An activity scheduled only between 9:00 A.M. and 4:00 P.M. can often be entirely daylit at a time when the outside temperatures are the warmest of the daily cycle.
By contrast, an activity that takes place only from 9:00 P.M. to 4:00 A.M. will be entirely dependent on electric lighting, whose heat can be used to over come the chill of the outside temperatures during these hours in winter. (In the summer, such heat can be flushed away with the cool outside night air in many U.S. locations.) Support systems are often divided by scheduling considerations: If one activity has operating hours different from those of the remainder of the building, a separate mechanical system is often provided. This saves energy, because large equipment will not be underused to provide heating or cooling for only one zone.
3. Orientation. The degree of exposure to day light, direct sun, and wind is obviously important to zoning. Consider the block-square office building floors (FIG. 4) on a cold, sunny, and windy day. Perimeter spaces with direct sun through the windows may gain more heat than is lost and thus need cooling. This might be done by the opening of windows, but too much cold air (especially on the windy side of a building) may make the workers near the windows uncomfortable. Perimeter spaces without direct sun may have a net heat loss due to heat loss through glass, infiltration, and reduced electric lighting (because daylight is adequate). These spaces will need heat from a mechanical support system. Interior (no-daylight) spaces are overheated by electric lighting because they cannot lose heat. These spaces will need cooling from the support system.
Zoning considerations are among the most important influences on building form and external design, along with the familiar aesthetic, social, legal, economic, and technical influences that combine in a tug of war familiar to the building designer.
3. DAYLIGHTING CONSIDERATIONS
Sizing of windows and analysis of daylighting performance will generally use the same guide lines for recommended daylight factor. Such guidelines are described in detail in Section 14, where they are discussed as a means of predicting daylighting performance. In previous Sections, windows and skylights have been seen as a liability because of winter heat loss and summer heat gain. It is time to consider their benefits numerically. This section will use daylighting guidelines in a preliminary example of window sizing for an office building.
When a building is designed to rely on day lighting, a prime design concern is the daylight factor (DF), which is expressed as a percentage of the outdoor illuminance under overcast skies that is available indoors.
DF = indoor illuminance from daylight outdoor illuminance × 100%
Some simple target overcast-sky daylight factors and the simplest design guidelines that provide these target daylight factors are presented in Tables 14.2 and 14.3. These design guidelines consider two factors: How high is the window in the wall, and how large is the window or skylight area compared to the floor area for each daylit space? The target daylight factors listed in Table 14.2 provide sufficient light during most of the daylight hours on overcast winter days. The relationship between office working hours, daylight, and out door temperature is explored in the climatic time tables of FIG. 5 for the building whose design diagrams appeared earlier (see FIG. 3). Much more light will be available on summer days- probably more light than is needed, bringing heat along with it. When sizing windows and skylights, remember that controlling direct sun is necessary and that less opening area is needed in summer than in winter.
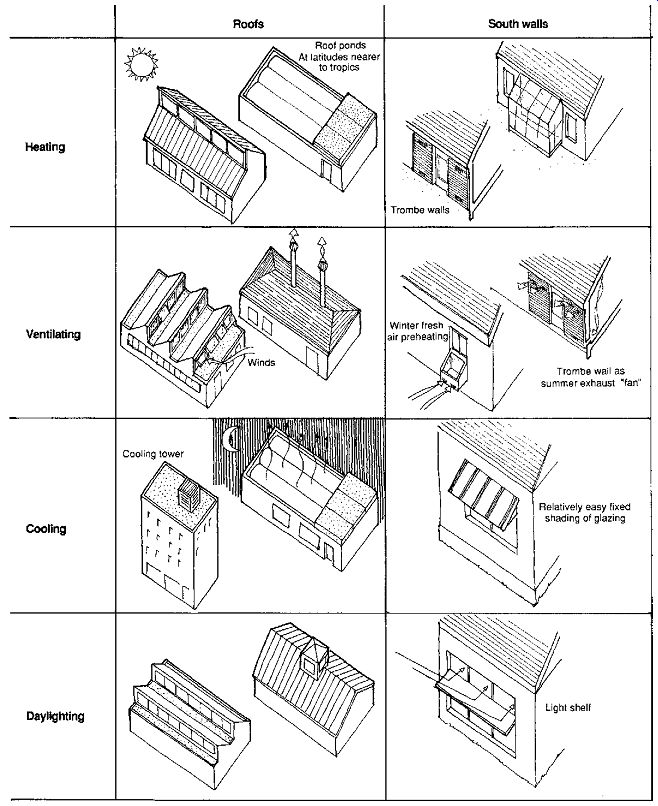
FIG. 2 The components of a building's envelope can be used both to conserve
energy and to admit on-site or natural energy sources.
EXAMPLE 1
Many of the design guidelines presented in this Section will be illustrated by applying them to a typical bay of the building in FIG. 6. This 24,000-ft 2 (2230-m^2) office building for an electric utility is located in Eugene, in western Oregon's wet-winter, dry-summer climate typical of the U.S. Pacific Northwest. Energy conservation and daylighting considerations played a major role in this building's design and were integrated with solar heating, night ventilation of mass, structure, and acoustics (see FIG. 3).
EXAMPLE 1 is an ongoing illustration. Applications of various design guidelines will continue to appear in the context of this example throughout this Section. TABLE 2 presents the type of information about a building that will be required in order to apply these design guidelines.
Part A. Daylight design Part B. Overall rate of heat loss (Btu/DD ft^2) Part C. Approximate solar savings fraction (SSF) Part D. Approximate heat gain Part E. Cross-ventilation guidelines Part F. Night ventilation of thermal mass guidelines Part G. January balance point temperature Part H. Annual SSF based upon the load to collector ratio (LCR) Part I. Clear January day indoor temperature swing Part J. Detailed night-cooling of mass calculation.
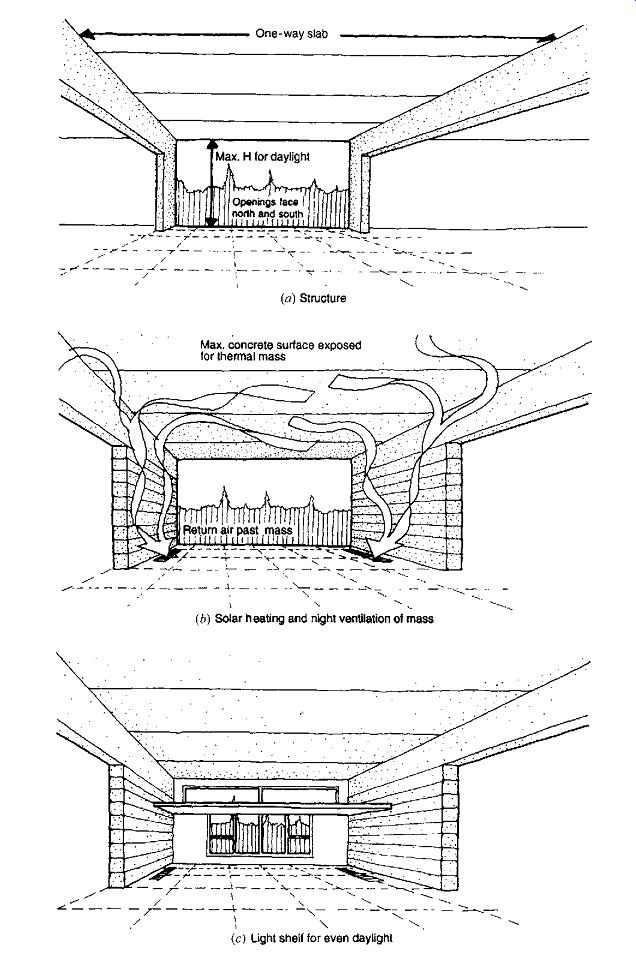
FIG. 3 Design diagrams explore opportunities in an office building in western
Oregon (see FIG. 6 for the resulting building). (a) Choosing a one-way structure
allows windows to be placed as high as possible for deeper daylight penetration.
(b) Maximizing exposed interior surfaces that are thermally massive facilitates
both winter solar heat storage and summer night cooling. Carpet was installed
at the insistence of the client. (c) Shaping the window with additional area
above a light shelf helps reduce the visual contrast near the window. (d) Indirect
electric lighting is facilitated when higher ceilings are available; less glare
on computer screens results. (e) With so much exposed mass surface, sound absorption
is a must. This solution continues to expose the concrete ceiling and does
not cast shadows from incoming daylight.
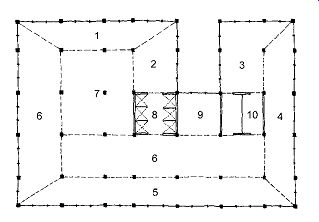
FIG. 4 Zoning for a mixed-use building with perimeter and internal zones
as well as varying types of use. Scheduling and/or internal load differences
within any one of these zones could require division into additional zones.
(Amanda Clegg.)
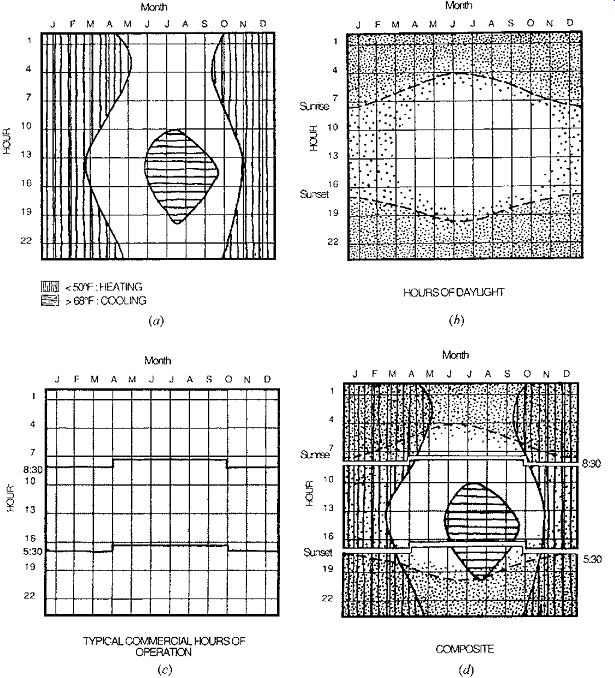
FIG. 5 A series of climate timetables was prepared while designing the office
building for the Emerald People's Utility District near Eugene, Oregon (FIG. 6). (a) Average outdoor temperatures show little daily variation in winter
but a large daily range in summer. (b) Daylight peaks around noon near the
summer solstice. (c) Work schedule shows the effect of summer's daylight saving
time. (d) A composite timetable indicates that daylight is available during
almost all working hours and that half of the hottest hours occur after the
building closes on summer afternoons-thanks to daylight saving time. Cool nighttime
temperatures make night ventilation of thermal mass an attractive cooling option
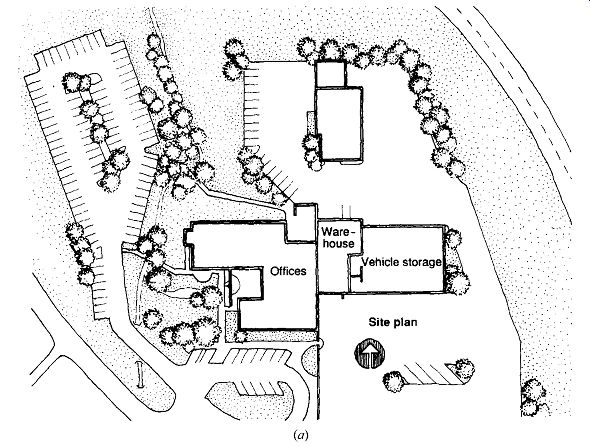
FIG. 6 The office building for the Emerald People's Utility District near
Eugene, Oregon, is elongated east-west for maximum window areas facing north-south.
(a) The site plan, (b) the ground-floor plan, (c) the second-floor plan, and
(d) a section through a two-story wing. The cutaway axonometric (e) of a typical
open-office two-story bay shows air flush through hollow cores of exposed precast
concrete slabs, windows and shading, and suspended sound-absorbing baffles.
The deciduous vines on trellises at the south façade change the building's
appearance by season; (f) at the summer solstice, the shading stripes will
soften as vines leaf out with age; at the fall equinox, the leaves will still
shade, whereas at the spring equinox (g) the branches will be bare to allow
sun to reach the windows; (h) at the winter solstice, most of the window is
exposed to the sun.
EXAMPLE 1, PART A
Daylighting design for this office building began with design diagrams (FIG. 3) and an assessment of daylighting potential (FIG. 5). After it was established that daylighting was avail able during almost all normal working hours, the building plan was organized so that almost all windows faced either south or north (FIG. 6) to avoid the problems of low-altitude sun (year-round glare and summer heat gain) that accompany east- and west-facing windows. Then the building section was designed so that the height of the windows (H) was related to the depth of the floor plan served by those windows (2.5H).
After a generous target DFav = 4.0% was chosen from Table 14.2, the next step was to size the windows and clerestories (as skylights), using the DF guidelines from Table 14.5. Applicable formulas for both sidelighting and for vertical monitor sky lights:
DFav = 0.2 window (or skylight) area floor area
Applied to an entire typical bay, DFav = 0.2 97 ft north+ 97 ft south+132 ft c 22 2 llerestory 1440 ft 2 = 0.45, or 4.5% slightly above the target DFav of 4.0%.
Note that in this example, DFmin from the side lighting occurs near the center of the building, at about the point (on the second floor) where the most light is available from the skylight. Therefore, relatively even daylighting distribution is expected on the upper floor. This is helped by the use of light shelves and the T-shaped windows shown in FIG. 6e.
The seasonal window size question (more needed in winter, less in summer) was answered in this example by the use of deciduous vines outside the south windows. In winter and cool spring, the vines are bare of leaves. Warm weather brings leafy shade lasting well into the warm fall (FIG. 6f ).
4. PASSIVE SOLAR HEATING GUIDELINES
When the building's function, climate, and site are favorable, winter solar gains can contribute greatly to a properly designed building. One of the first criteria to be considered is energy conservation; there is the envelope and infiltration. To determine the whole-building heat loss rate, list for each envelope component (roof, walls, floor, windows, etc.) the U-factor (Section 7 and Section E) and the total exposed area A; then simply multiply U × A. (For slab floors on grade, see Section 7 for deter mining perimeter heat losses.) For the special cases of walls below grade, such as berm walls, an approximation is needed. During the coldest weather, the temperature outside such walls will nearly always be higher than the outdoor air temperature, so any procedure based on Btu/DD will over-predict the heat loss through these walls.
As a result, designers often calculate the UA of below-grade walls by using their actual U-factor but using only half of their actual area; this lesser UA roughly compensates for the lesser ?t through these walls.
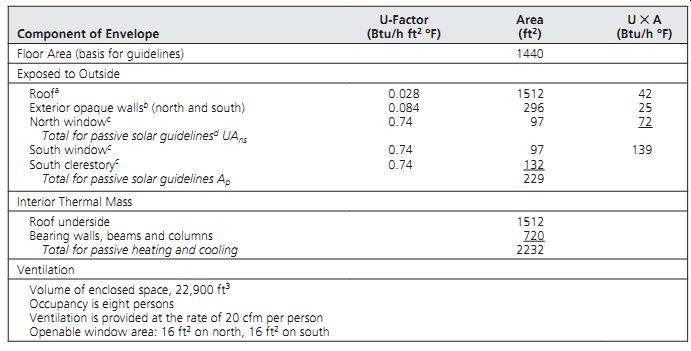
TABLE 2 Design Data for a Typical Second-Floor Bay of the Office Building
(FIG. 6e)
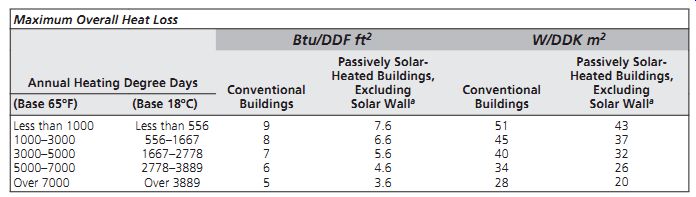
TABLE 3 Overall Heat Loss Criteria for Solar Guidelines
For infiltration, determine the number of air changes per hour (ACH) under winter design conditions and multiply this infiltration (or fresh air) rate little benefit in pouring solar heat into a leaky building. For solar designers, the motto should be "Insulate before you insolate."
(a) Whole-Building Heat Loss Criteria
The recommended maximum rates of heat loss (in Btu per degree days [DD] per square foot) shown in TABLE 3 are the basis for development of the following passive solar heating guidelines. They are also useful as a quick check on overall envelope performance in residential or small commercial buildings. (Some states have adopted similar criteria as part of their building codes; be sure to check the applicable code before relying on these numbers for code compliance.) The heat loss rates are shown for two conditions:
1. Conventional (non-passively solar-heated)
small buildings. The overall rate of Btu/DD ft^2 is based on total heat loss, including all portions of by a constant that accounts for density and specific heat:
or ACH (volume, m ) 0.33 =
ACH (volume, ft ) 0.018 = 3 3
UA for infiltration
Add the envelope UA values to those for infiltration, multiply by 24 h/day to account for DD, and divide by the building's total heated floor area:
(+ )24h totalh envelope infiltration UA UA × heated floor area(ft )
=Btu/DDft^2 2
2. Passively solar-heated buildings. Here the overall rate of Btu/DD ft 2 excludes the solar collecting portion(s) of the envelope; otherwise, it is based on total heat loss from all other portion(s) of the envelope, and it includes infiltration. The equation used to determine the overall solar building rate is as follows:
( envelope, except south glass infiltr UA UA + a ation 2 ) 24h total heated floor area(ft )
×
= Btu/DD ft^2
One of the biggest unknowns in this procedure is the assumed rate of infiltration. A care fully designed and constructed small building can easily achieve a rate of 0.75 ACH; with increased attention to air barrier installation, caulking of all cracks, and so on, rates below 0.33 ACH have been demonstrated.
Passive solar heating and energy conservation have a complex relationship. Relative to conventional buildings, passively solar-heated buildings usually conserve purchased energy; yet, buildings that aim at very high percentages of solar heating can use more total heating energy than is used by buildings with smaller window areas. Designers interested primarily in saving purchased energy may aim at lower solar percentages and more insulation; designers interested in buildings that closely relate to climate and climatic changes may aim at higher solar percentages (and more daylighting), along with higher thermal masses and, probably, greater ranges of indoor temperature.
(b) Solar Savings Fraction (SSF)
The term solar savings fraction is used to express a building's solar heating performance. The SSF is the extent to which a solar design reduces a building's auxiliary heat requirement relative to a "reference" building-one that has, instead of a solar wall, an energy-neutral wall that experiences neither solar gain nor heat loss; otherwise, the solar building and the reference building are identical. The SSF compares the auxiliary energy needed by the solar building to the auxiliary energy needed by the reference building, as illustrated in FIG. 7. Remember that the SSF is not the percentage of the solar building's heat supplied by the sun; typically, the sun provides a much higher fraction of a building's total space heat than suggested by the SSF. Rather, the SSF is more a measure of the solar building's conservation advantage.
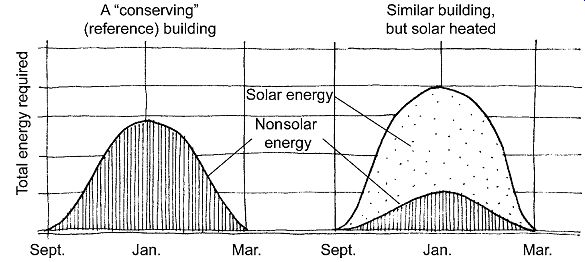
FIG. 7 The solar savings fraction compares the auxiliary heat needed by
solar-heated buildings to that needed by a non-solar but energy-conserving
building that is otherwise similar (called the "reference" building).
For example, if the solar building needs 25 units of auxiliary (non-solar)
heat per year and the reference building needs 70 units, the difference is
70 - 25 = 45 units, or 64% of the reference 70 units. Therefore, SSF = 64%.
(Note, however, that the solar building is 75% solar heated.)
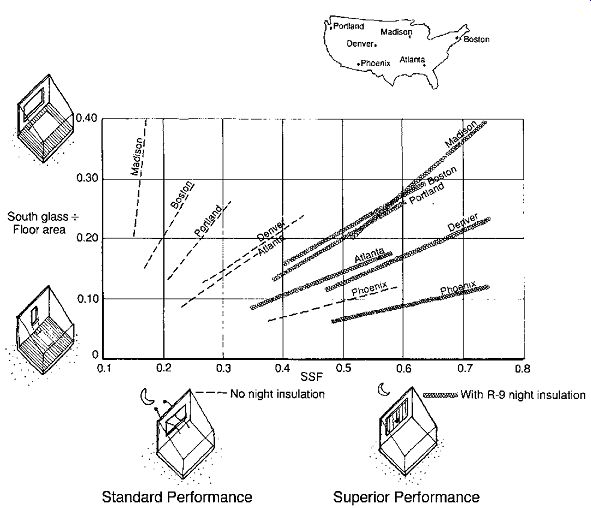
FIG. 8 Design guidelines for passive solar heating: ratio of south glass
to floor area. The information in Table F.1 is presented graphically for six
U.S. cities. "No night insulation" = standard performance; "With
R-9 night insulation" = superior performance.
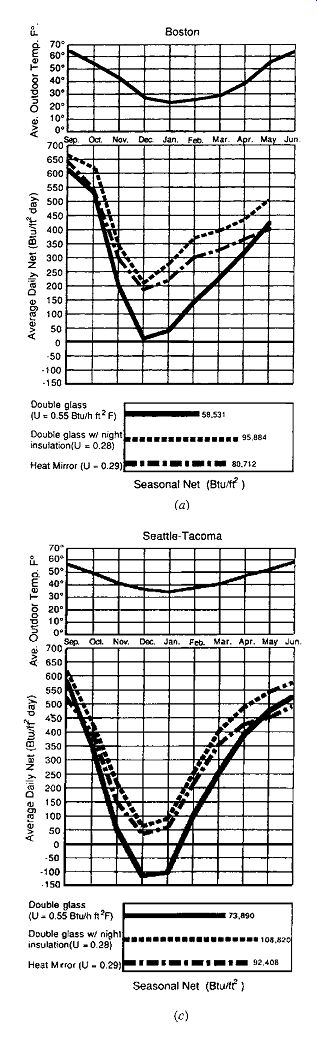
FIG. 9 Average daily net heating, per square foot of south window, for three
glazing assemblies in three climates. (a) In Boston, ordinary double glazing
is a slight energy plus even in December. (b) In Madison, ordinary double glazing
is a net loser for almost 2 months. (c) In Seattle, ordinary double glazing
is a net loser for more than 2 months.
A starting point for passive solar preliminary design is Table F.1. For your location, both a range of SSF values and a range of ratios of areas of south glass/floor area can be determined. The table shows the SSF ranges for both "standard performance" (simple double-glazed windows) and "superior performance" (for either night-insulated or super window) solar openings. This same information is shown graphically for six geographically diverse locations in FIG. 8. (Add your own location's information from Table F.1 to a copy of this graph.) The difference between standard and superior performance is explored in FIG. 9 for the September-June period in Boston, Madison, and Seattle. The solid line charts the lower performance of simple double glazing (listed as U = 0.55 Btu/h ft^2 ºF). The other two higher-performance alternatives (movable insulation and superwindows) show why the newer superwindows have made movable insulation nearly obsolete: without the need for any actions by the user, superwindows have a higher net heat gain than movable insulation in all three locations.
(c) Thermal Mass
Another early design question involves the amount of thermal mass (area) necessary to store the solar heat admitted each day. This reveals the simplistic, early-design nature of Table F.1, because it does not distinguish between the various approaches to passive solar heating (direct gain, indirect gain, and isolated gain, as discussed in Section 4). Table F.2 details the simple relationship between SSF and the area (also the weight) of water or masonry that should be provided in direct-gain designs.
The distribution of the thermal mass is also important, however. Indirect gain systems (Trombe wall and water wall systems) usually place the thermal mass in full sun for the entire day, often just inside the glazing. In direct-gain systems, this thermal mass should be within (or should enclose) the direct-gain heated space, and the exposed surface area of the mass should be at least three times the glazing area. Masonry surfaces are less thermally effective (on a daily basis) beyond a depth of about 4 to 6 in. (100 to 150 mm). Note that the thermal storage area is relatively unimportant at low SSF values, but as the SSF increases, so does the relative proportion of thermal mass area to solar glazing.
Phase-change materials are an alternative to simple thermally massive masonry surfaces. Flat bags of eutectic salts are shown in FIG. 10. Thin, horizontal tiles packed with these phase-change materials can store great quantities of heat with the phase change from solid to liquid. This change can be formulated to occur in the low 70s ºF (20s ºC) to pre vent overheating of the space. As flat tiles enclosing bags of salt, they can form the finished surface in any horizontal application-floors, ceilings, or counter- and tabletops, for example. Tubes and trays of salts can be arranged as desired. Because the function of these materials is to keep room temperatures steady, their performance in preventing overheating on a sunny winter day will also be appreciated on hot summer days, provided they are taken below the phase change or melting temperature at night. For U.S. locations with large daily temperature ranges in summer (see example mean daily range values in Section B), thermal storage surfaces for passive solar heating in winter are potentially useful for night ventilation cooling in summer.
As a preliminary guide, the phase-change tile surface area = one to three times the area of solar opening. Additional information on these materials can be found in Johnson (1981).
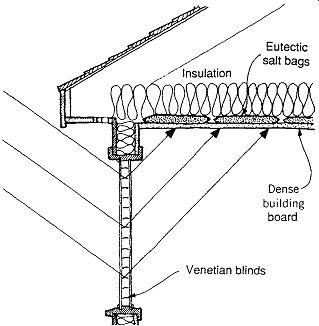
FIG. 10 Using bags of phase-change material (eutectic salt) for thermal
storage above a flat ceiling. Mirrored-surface venetian blinds reflect direct
sun to the ceiling, where it strikes a heavy (at least 90 lb/ft 2 [440 kg/m2])
board product with high conductivity. Metal ceilings or plaster are also suitable;
ordinary gypsum board is not sufficiently conductive. Bags of salt weighing
5 lb/ft 2 (25 kg/m2) are in contact with the ceiling material and must be installed
in a horizontal position. They are usually formulated to melt between 70 and
75ºF (21 and 24ºC). (Johnson, 1981.)
The Society for the Protection of New Hampshire Forests building utilizes phase-change storage above a metal ceiling (FIG. 11). It also uses water filled tubes as an interior partition, masonry interior walls, and a concrete floor slab to help store the winter daily solar gain.
The New Canaan Nature Center (FIG. 12) is another innovative New England example using many passive/low-energy components. In addition to eutectic salts used in the south-facing railing on the upper level, the 4000-ft 2 (372-m2) building utilizes extensive clear, double-glazed south glass, movable insulating shades, operable vents at the skylight for stack-effect ventilation, ceiling fans, a woodstove, solar collectors placed inside the skylight monitor (their water is used for warming planting beds), warm air heat recovery ducts, a well-insulated envelope, and even a rainwater collection system. The manually operated switches for ventilation, insulation, and shading represent an unusual degree of user-building interaction. There is also unusual attention to microclimates and the transition between inside and outside in this award winning building.
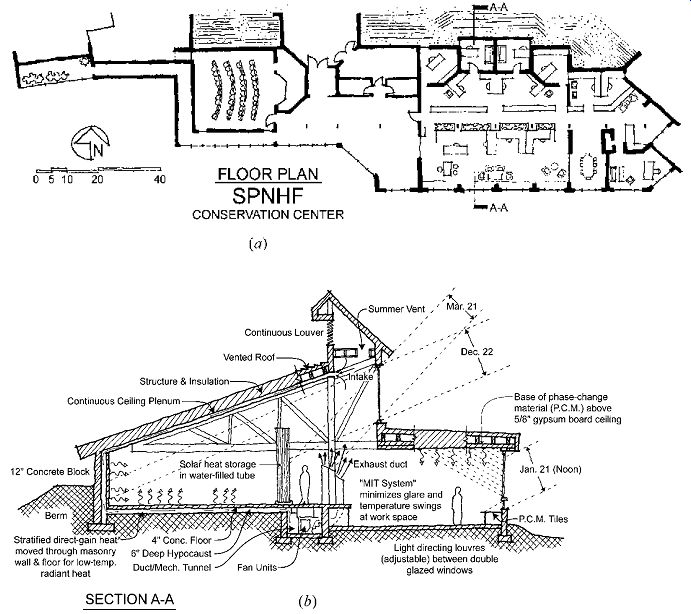
FIG. 11 The Conservation Center for the Society for the Protection of New
Hampshire Forests, Concord, Banwell White Arnold Hemberger & Partners,
Architects. (a) The plan is elongated on the east-west axis to maximize southern
exposure and facilitate daylighting. Direct gain serves the reception area,
workroom, and offices, and a sunspace double envelope combination warms the
lecture room. A wood-fired boiler provides backup heat. (b) Section with south
glazing and thermal storage materials: trans lucent water tubes, masonry walls,
and phase-change materials in ceiling and windowsill positions. The circulation
of hot air that collects at the clerestory is also shown. In summer, the hot
air is vented, and an awning shades the clerestory. Daylighting is dif fused
through translucent tubes to the spaces on the north side. (c) At the workroom,
mirror-finish venetian blinds reflect direct sun to the phase-change materials
in bags above the dark metal deck ceiling.
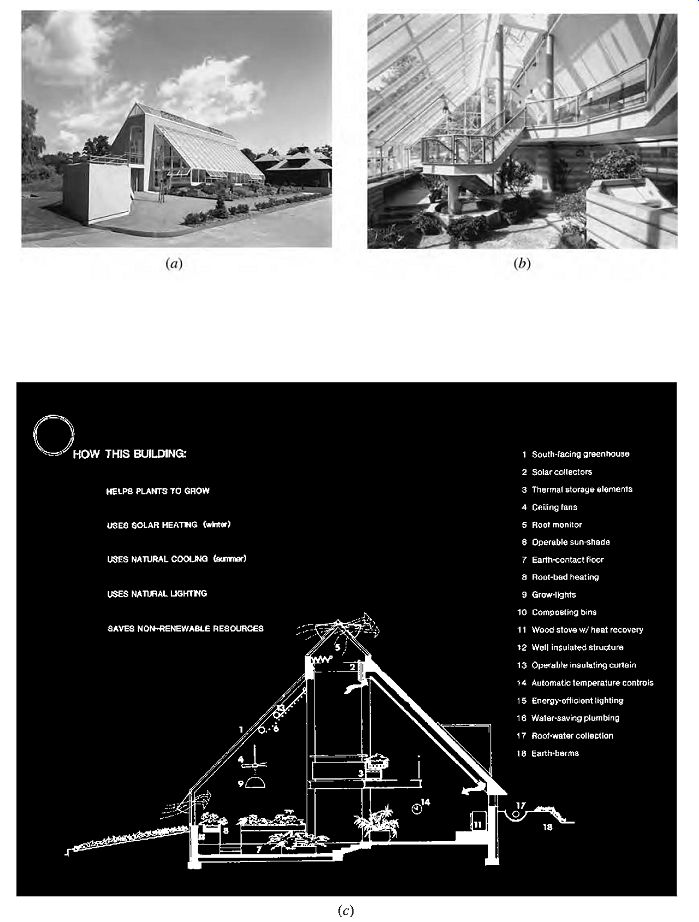
FIG. 12 The New Canaan ( Connecticut) Nature Center (a, b) illustrates many
passive and low-energy components. (c) Section illustrates the design features
that utilize renewable energy and enhance energy conservation. The thermal
storage elements are filled with eutectic salts that absorb excess solar heat
via phase change (from solid to liquid) by day, then again change phase (from
liquid to solid) at night to release their stored heat to the space.
Rock beds are sometimes used to store the excess heat that isolated-gain (sunspace) systems can generate. They are typically placed directly beneath a concrete floor slab. The disadvantage of this approach is that any below-grade location raises suspicions of condensation and/or ground water that may facilitate mold growth, yet cleaning of the rock bed is difficult.
The general guidelines cited by Mazria (1979) are as follows:
Rock bed volume, ft 3, per ft 2 of solar opening
Cold climates: ¾ to 1½
Temperate climates: 1½ to 3
Rock bed surface area in contact with floor above
Cold climates: 75% to 100% of floor area above
Temperate climates: 50% to 75% of floor area above
(d) Orientation
How important is it that the passive solar opening face due south? The general recommendation is that this orientation be within 30º of south. In The Passive Solar Design Handbook, the average penalties for off-south orientation are listed as follows.
5% decrease in SSF at 18º east or 30º west of true
south 10% decrease in SSF at 28º east or 40º west of true
south 20% decrease in SSF at 42º east or 54º west of true
south
See Section 10 for more detailed coverage of passive heating performance that distinguishes among direct, indirect, and isolated gain systems and includes the expected annual auxiliary energy needed by a passively solar-heated building. Select 20% of the floor area for south glass: SSF = 51. Thermal mass can be estimated from Table F.2; for SSF = 50, either 30 lb of water or 150 lb of masonry (per square foot of south glass) should be provided. Using brick as a thermally massive surface, 3.7 ft^2 of brick should be provided for each square foot of south glass
(e) Roof Ponds
This is yet another approach to passive solar heating, one not covered by the preceding guidelines. In general, roof ponds are used in warmer, less humid areas of the southern United States, where snow will not impede the movement of roof insulating panels, and the winter sun is higher in the sky than at northern latitudes. They are frequently sized for their summer cooling performance. In the U.S. southern latitudes, a pond sized for cooling will usually be adequate to absorb the needed winter sun.
As a check for the pond's heating capacity, Mazria (1979) recommends the following guidelines:
Roof pond area = 85% to 100% of floor area for winter average outdoor temperatures of 25ºF to 35ºF (-4ºC to +2ºC)
Roof pond area = 60% to 90% of floor area for winter average outdoor temperatures of 35ºF to 45ºF (2ºC to 7ºC)
These guidelines are for roof ponds that have two layers of enclosing material between the water and the sky (i.e., are "double-glazed") and movable night insulation.
(f) Active Solar Heating
In contrast to passive systems, which incorporate sun collection and storage as part of a building's walls, floors, or ceilings, active solar heating uses mechanical equipment to collect and store solar energy. The most common early design questions for such systems involve the area of the solar collectors, their tilt and azimuth, and the size of the thermal storage. (Domestic hot water [DHW] solar heating information is given in Section 21.) For active solar space-heating systems, the rules of thumb are reasonably complex. Building heating needs vary by function and climate. The percentage of space heating that can economically be provided with active solar systems is another big variable. Nevertheless, a rough guide is desirable as a design starting point:
Collector/floor area ratio = the smaller of the two window/floor area ratios listed in Table F.1 This should provide a portion of the annual heating load somewhere in the range of high-performance SSF from Table F.1. Larger arrays of collectors can be designed, of course, but they rarely will be economically attractive.
For collector tilt and azimuth optima:
Optimum tilt = latitude plus 10º to 15º; optimum azimuth is from due south to 15º W of south where the tilt angle is measured up from horizontal.
The orientation somewhat west of south is attractive in climates with frequent morning fog. Also, because air temperatures are higher in the after noon, collectors lose less heat then and therefore operate more efficiently.
The design guidelines for storage size are as follows:
2 gal of water storage per ft^2 (81 L per m^2) of collector or 0.5 to 0.75 ft^3 of rock bed per ft^2 (0.15 to 0.23 m^3 per m^2) of collector
The large arrays of collectors necessary for space heating must be served by pipes or ducts. Whereas pipe size rarely influences design, air ducts for air type collectors can consume fairly large amounts of space. The following flow rates are typical for active solar collectors:
water flow rate of 0.25 to 0.5 gpm per ft^2 (0.17 to 0.34 L/s per m^2) of collector or airflow rate of 2 cfm per ft^2 (10 L/s per m^2) of collector
5. SUMMER HEAT GAIN GUIDELINES
Design guidelines for cooling are complicated by the fact that cooling loads frequently are more closely related to individual building characteristics than to climate; sunshading and internal heat gains are particularly influential on cooling loads. Because passive cooling guidelines (Section 6) are expressed in heat to be removed per unit of floor area, it is first necessary to estimate the extent of the heat gain problem. Later, more detailed passive cooling procedures are shown. A comparison of the guidelines with these more detailed procedures is given in TABLE 4.
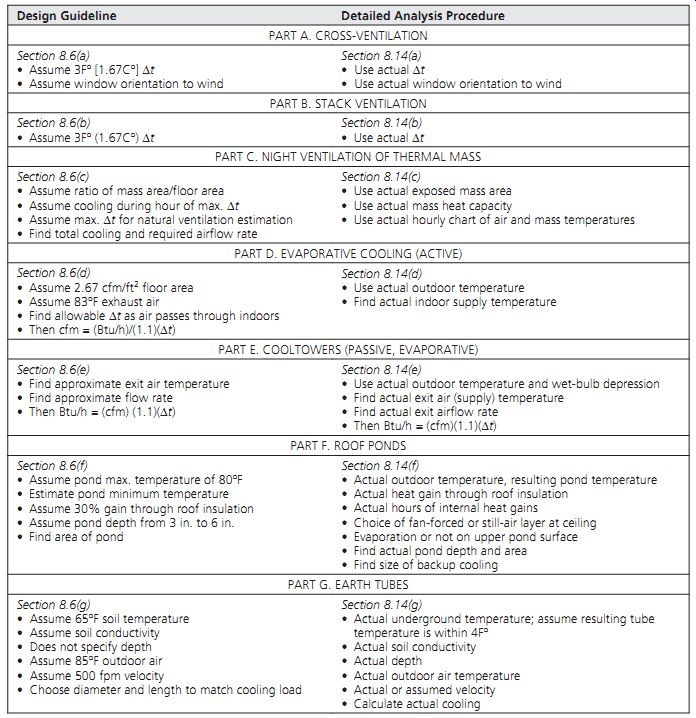
TABLE 4 Comparing Passive Cooling Design Guidelines with Detailed Calculation
Procedures
Detailed calculations for heat gain are presented in Sections 11 and 13. For now, Table F.3 gives a quick approximation. Many buildings (restaurants, factories, stores selling heating appliances, etc.) have special heat sources within. For these unusually heat-loaded situations, Table F.3 will be inadequate. As a starting point for preliminary passive-cooling sizing for typical buildings, however, it should be helpful. Climate information is available from a variety of sources, including the ASHRAE Handbook-Fundamentals (extensively updated climate data produced by a recently completed research project was included in electronic format in the 2005 edition) and ASHRAE Standard 90.1-2007. The data in these two sources are derived from different approaches. Updated (2005) climate information for various U.S., Canadian, and Mexican locations is included in Appendices B.1-B.4. For some of the example problems that follow, climate data referenced to Section B.5 are indicated (these are legacy data for locations not available in the 2005 data set). Notations herein to Tables B.1-B.5 refer to Section B.
Note that "open" buildings, such as those that are naturally ventilated, do not have heat gains from infiltration, because they assumedly maintain internal temperatures that are slightly above exterior temperatures (and air leakage would cool). However, these buildings do experience heat gains through windows, walls, and roofs due to solar impacts on these surfaces. For "closed" buildings, heat gain from infiltration or ventilation must be added, because these structures maintain internal temperatures lower than outside temperatures.
6. PASSIVE COOLING GUIDELINES
The design guidelines for passive cooling are much newer and less tested than those for passive heating. It is important that the designer first check the match between the climate and the cooling strategy, as was done in Section 4, before applying these guidelines to a building design.
(a) Cross-Ventilation
One of the oldest methods known, this strategy provides plentiful fresh air but maintains a building at temperatures slightly above those out doors. The cross-ventilation inlet (window) areas, expressed as percentage of total floor area, are related to wind speed and resulting heat removal in FIG. 13. Remember that an equal (or greater) area of outlet openings must also be provided. Furthermore, any internal obstructions (such as partitions) must have a total area of openings at least equal to this required inlet area. The assumptions about wind direction and indoor-outdoor temperature differences that were used to produce these guidelines are explained in the figure. For more detailed wind speed and direction information, see Section 14.
FIG. 13 Cross-ventilation design guidelines for heat removed per unit floor area and relationship of inlet openings and wind speed. The total inlet opening area is expressed as a percentage of the total floor area served by cross-ventilation. Note: Outlet areas must also be at least equal to inlet areas. This graph is based on an internal temperature 3Fº (1.7Cº) above the exterior temperature and assumes that the wind is not quite perpendicular to the window openings, for a wind effectiveness factor of 0.4 (see Section 14).
The ?t of 3Fº used in FIG. 13 is deliberately kept small to encourage open strategies in milder summer climates. Thus, an interior temperature of 83ºF, which is comfortable with sufficient air motion, lower RH, and comfortable surface temperatures, would be obtainable with an outside temperature of 80ºF. However, a greater ?t is often appropriate-for example, for spring or fall cooling of office buildings, or for summer cooling of factories or kitchens where internal temperatures may remain in the low 90s. In such cases, find the percentage of inlet area required; then multiply by the ratio 3Fº actual ?t to obtain required cross-ventilation areas for any specific temperature difference (see EXAMPLE 1, Part E).
See TABLE 4 for a comparison of these design guidelines with the more detailed calculations of Section 14 for both cross- and stack ventilation.
(b) Stack Ventilation
This is another historically useful strategy, which, like cross-ventilation, provides plentiful fresh air but maintains a building at temperatures slightly above outdoor temperatures. The stack inlet areas, expressed as percentage of total floor area, are related to stack height and the resulting heat removal in FIG. 14. Remember that an equal (or greater) area of stack outlet openings, as well as at least an equal cross-sectional area through the vertical stack, is also required. Again, consider internal obstructions: partitions must have a total of openings at least equal to this required inlet area. The assumptions about indoor-outdoor temperature differences that were used to produce this guideline are explained in the figure.
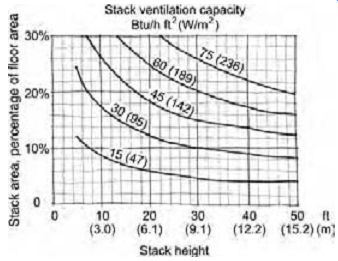
FIG. 14 Stack ventilation design guidelines for heat removed per unit floor
area and the relationship of stack height and inlet openings. The area of stack
inlet/throat/outlet is expressed as a percentage of the total floor area served
by stack ventilation.
Note: Outlet areas and the stack throat area must also be at least equal to inlet areas. This graph is based on an internal temperature of 83ºF and an exterior temperature 80ºF, for a 3Fº differential (28.3ºC internal, 26.7ºC external, for a 1.6Cº differential).
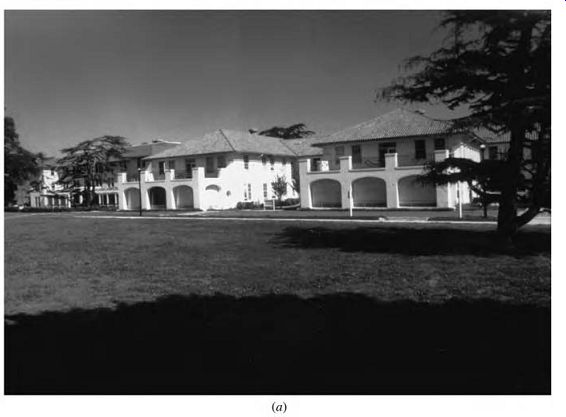
FIG. 15 The Thoreau Center for Sustainability occupies renovated hospital
buildings (a) in San Francisco's Presidio National Park. (b) Relatively narrow
floor plans facilitate daylighting and natural ventilation. (c) Interior at
the center corridor. (d) Section illustrates day lighting and cross-ventilation.
Very small stack openings relative to the floor area served limit the stack
effect to a minor role.
Adjustment of the ?t for this guideline is similar to the procedure for cross-ventilation. It requires multiplication of the required percentage of stack area by the ratio
3ºF actual ?t
to obtain the required stack ventilation areas for any other specific temperature difference.
Until the advent of air conditioning, these methods of cross- and stack ventilation were used in virtually all commercial buildings. In some climates with mild summers, newer buildings are turning to these older methods (refer to FIG. 46). FIG. 15 shows the Thoreau Center for Sustainability in San Francisco's Presidio National Park. An older military hospital was renovated for offices for nonprofit environmental organizations.
To maximize daylighting and passive cooling, the original operable windows are utilized. Interior partitions are kept low enough to facilitate cross ventilation, with integral indirect electric lighting using the high white ceiling. The section indicates that both cross-ventilation and stack effect are anticipated. However, the stack openings to the attic and, subsequently, through the roof are less than 1% of the total floor area. The most likely benefit of the stack effect here is to keep the attic at cooler summer temperatures (with air drawn in at the eave vents, not flowing outward as shown).
(c) Night Ventilation of Thermal Mass
This strategy maintains a building at temperatures lower than those outside by day and flushes the building with plentiful fresh air by night. The sizing procedure is shown in FIG. 16, where climate data are related to two representative types of thermally massive building. For each type, the graphs show the daily Btu per square foot of floor area that can be stored. The "average" mass building is represented by a building with an exposed concrete floor 4 in. (100 mm) thick (or an exposed ceiling of equivalent construction). There is one unit area of exposed mass for each unit floor area.
The "high" mass building is similar to the typical passively solar-heated, direct-gain building or to a multistory building with an exposed concrete structure, in which both sides of the floor slab are available for thermal storage, or an equivalent exposed mass area in walls, and so on. For this building, there are two units of exposed mass for each unit of floor area.
The climate data needed for FIG. 16 (maximum summer design DB temperature and mean daily range) are given in Appendices B.1 through B.5. These data also allow calculation of the mini mum summer design DB temperature; that is, maximum design DB temperature minus mean daily range. This minimum temperature is of interest here because the thermal mass of the building will be lowered toward (but not quite to) it during night ventilation. For high daily range climates, the lowest temperature obtained by the thermal mass will be about one-fourth of the mean daily range above the minimum air temperature (for lower daily range climates-30Fº or less-one-fifth of the mean daily range).
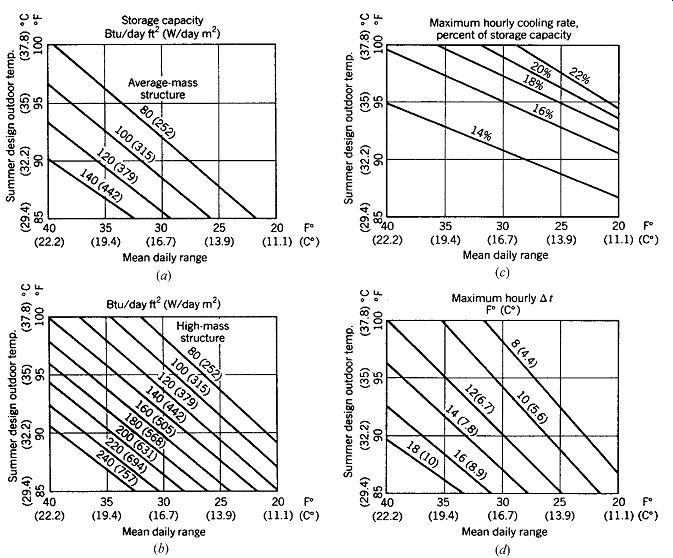
FIG. 16 Night ventilation of thermal mass design guidelines. Parts (a) and
(b) show Btu/day stored and removed per ft 2 of floor area (W/day per m2 of
floor area). Enter these graphs with your location's summer design outdoor
DB temperature and the MDR (mean daily range). (a) "Average mass" structure
has one unit area of mass surface exposed per unit area of floor area, where
the mass is a 4-in. (100-mm) ordinary-density concrete slab. (b) "High-mass
structure" has two units areas of mass surface exposed per unit area of
floor area, where the mass is a 3-in. (75-mm) ordinary-density concrete slab
(or both sides of a 6-in. [150-mm] concrete wall or slab exposed). Both average-
and high-mass structures go into "open" mode when the outdoor temperature
drops below 80ºF (26.7ºC); therefore, the highest mass temperature is assumed
to be 80ºF (26.7ºC). Part (c) shows the approximate percentage of the daily
total heat stored that is removed during the nighttime hour of maximum cooling.
Part (d) shows the ?t between the outside air and inside mass that exists during
that hour of maximum cooling. Required ventilation rates can then be determined
from (c) and (d).
Before this information can be fully utilized, the number of hours for which the building must be "closed" must be determined. During these hours, heat will be stored in the structure, up to the maxi mum storage indicated in FIG. 16. Typically, these buildings will go into the thermally closed mode (allowing minimum ventilation only) at about 6:00 A.M. for a day with 100ºF maximum or about 8:00 A.M. for a day with 85ºF maximum, remaining in the closed mode until the outdoor tempera ture drops below 80ºF. (To approximate this hour, assume that the midpoint outdoor temperature, between daily high and daily low, occurs at around 10:00 P.M.) Thus, the typical office building remains thermally closed during the 8 or 9 hours of summer occupancy. All the heat generated during the closed mode-8 to 9 daytime hours-must be stored in the structure:
Heat to be stored/ft^2 floor area = hours occupied in closed mode × heat gain, Btu/h ft^2 floor
Having found the amount of heat that can be stored each day, the designer must then solve the problem of removing the heat by night. Either natural or forced ventilation can be used, but in many locations wind speed is very low on summer nights.
The ventilation rate is determined by the "best hour" of cooling during the night, that is, the hour during which the temperature difference, ?t, between inside mass and outside air is greatest, and hence the most heat is removed. This "best hour" information can be found in FIG. 16c and FIG. 16d. Then the cross- or stack ventilation rules of thumb can be used to size the openings.
See TABLE 4 for a comparison of these guide lines and more detailed calculation procedures for night ventilation of thermal mass.
The administration building for the Fetzer Winery sits among grapevines in northern California's Mendocino Valley (FIG. 17). The summer design condition is approximately 96/68, with MDR 30Fº (35.6/20, MDR 16.7Cº). As an average-mass structure, this building could store and remove about 60 Btu/ft 2 day (190 W/m2 day); as a high-mass structure, it could store and remove about 100 Btu/ft^2 day (315 W/m^2 day).
(d) Evaporative Cooling
The most common evaporative cooler is not strictly passive cooling, as it depends on a fan to force large quantities of outdoor air through a wet filter, thereby lowering the air's temperature and raising its RH before delivering the air to the space to be cooled. In hot and arid climates, the energy used by the fan in evaporative systems is less than the energy needed to achieve conventional cooling based on the compressive refrigeration cycle. Although this process requires quantities of water, it does not use refrigerants that may pose a threat to the Earth's environment.
Before using these guidelines, be sure to check the cooling strategy chart in Section 4 to determine whether evaporative cooling is appropriate for your climate. It is unlikely that evaporative cooling will be helpful in the humid southeastern United States.
The rates of evaporative cooling presented in FIG. 18 are based upon a rather high airflow of 2.67 cfm per ft^2 of floor area. (In conventional cooling, an airflow rate closer to 1 cfm per ft 2 is more common.) With this amount of air motion, a highest indoor air temperature of 83ºF is assumed; so the evaporatively cooled air, after absorbing heat from the space, exits at 83ºF. (Note: this may still be well below the outdoor temperature: might it do some useful cooling?) To use FIG. 18, first find in Table B.1 the summer design DB and mean coincident WB temperatures for your location.
Enter the graph at these two data points, and at their intersection find the approximate amount of heat in Btu/h ft^2 that evaporative cooling can remove. As WB temperatures surpass 68ºF (rep resented by dotted lines in the graph), indoor conditions become increasingly humid, producing almost certain discomfort with an indoor WB temperature of 75ºF.
A more thorough method for evaluating evaporative cooling potential is presented in Section 14, where various airflow rates and temperatures of supply air and exit air can be examined.
See TABLE 4 for a comparison of this guideline and the more thorough method.
(e) Cool towers
FIG. 17 The Fetzer Winery administration building (a) in its rural Mendocino County, California, setting. The south-facing clerestory and a deciduous vine and trellis are the more visible parts of the daylighting, passive solar heating, and passive cooling strategies. (b)
Plan shows the relation of a workstation to north and south daylight. (c) Section with ducts for the night air flush as well as for conventional heating and cooling. (d) North-side dormers are for night air intake and exhaust.
A more passive approach to evaporative cooling appears as a tower on the residence in FIG. 19.
This University of Arizona experimental building near the Tucson Airport has a cooltower with wetted pads on all four faces at the top. Hot, dry air is cooled as it passes through the pads, dropping to the base of the tower and then into the house. Analysis by Givoni (1994) indicates that such a tower's delivery of wetter, cooler air is almost independent of wind speed and also is not dependent on the second tower at the opposite end of this building, a solar chimney through which air from the house is discharged.
Temperature and flow rate of air delivered to a building by a passive cooling tower can be approximated from FIG. 20, but such data are based on very little experimental work. A well-regarded building using this principle, as well as Trombe wall passive solar heating, is the Zion National Park Visitor Center (FIG. 21).
FIG. 18 Fan-forced evaporative cooling design guideline for Btu/h removed per ft^2 of floor area (W per m^2). A forced airflow rate of 2.67 cfm per ft^2 of floor area (13.56 L/s per m^2 of floor area) is assumed, as is an exiting (exhaust) air temperature of 83ºF (28.3ºC). The dashed lines toward the left side of the graph represent increasingly humid indoor air, which may cause discomfort.
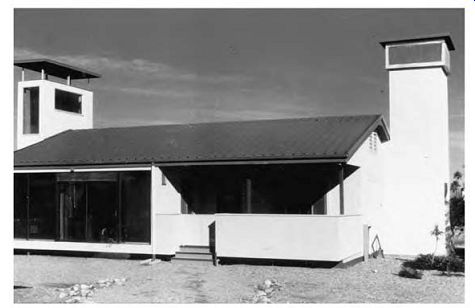
FIG. 19 An experimental residence in Tucson, Arizona, is passively and evaporatively
cooled by a cooltower (at the right in the photograph). Hot, dry air passes
through the wetted pads at the tower's top and undergoes a drop in DB temperature
that causes it to fall, entering the residence at the bottom of the tower.
The tower at the left is a solar chimney to help speed the flow of warmed exhaust
air.
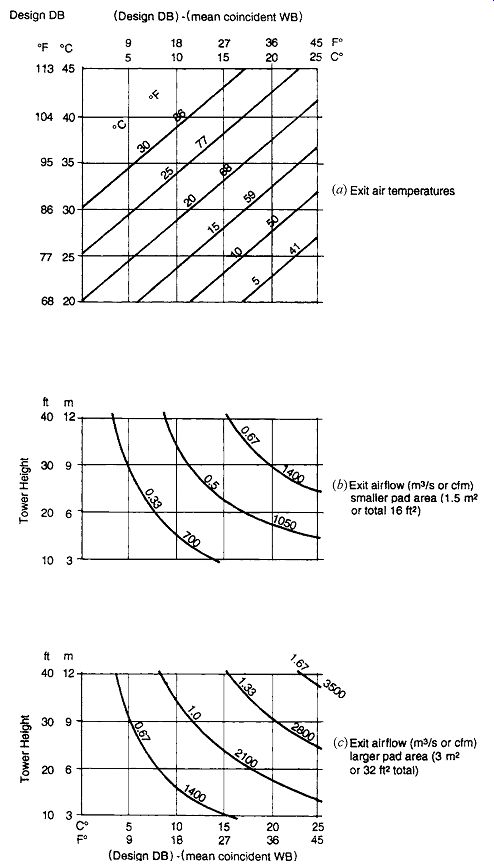
FIG. 20 Design guidelines for cooltowers. (a) The temperature of the air
as it leaves the cooltower (enters the building) depends on the outdoor DB
temperature, as well as the difference between the DB and WB temperatures.
The flow rate of the exiting air depends on the tower height, as well as the
difference between the DB and WB temperatures. (b) Flow rate for a smaller
area of wetted pads, 1.5 m^2 (16 ft^2). (c) Flow rate for a larger area of
wetted pads, 3 m^2 (32 ft^2).
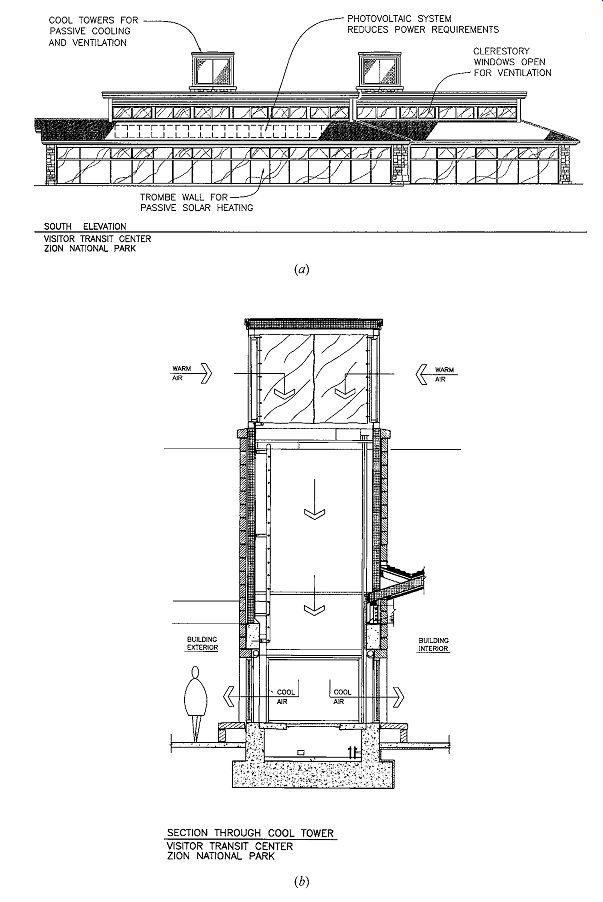
FIG. 21 The Visitor Center at Zion National Park ( Utah) features both cooling
by cooltowers and solar heating (a) by Trombe walls and a clerestory. Because
many of the building's functions can be performed outside, each cooltower (b)
has both an indoor and an outdoor outlet, either of which can be closed off
when not needed. Air enters through wet media pads at the top of the tower
(c). An X-baffle then diverts the air downward. The building also features
photovoltaics (PV) and water harvesting.
(f) Roof Ponds
This promising strategy has rarely been implemented, possibly due to water phobia among architects and clients alike. Yet it demonstrates the most stable interior temperatures of any of these techniques, needing electricity only to open and close the sliding insulation panels on the roof. Roof ponds sized for cooling will likely be nearly equal in area to the floors of the buildings they cool. Average pond depth is between 3 and 6 in. (75 and 150 mm). A more detailed and precise procedure for determining pond area is presented in Section 14, but here is the quick approximation:
• Pond maximum* temperature: 80ºF (*this temperature is based upon the assumption that any higher pond temperature would fail to produce cooling for the building interior)
• Pond minimum temperature = minimum night time DB (= max. daytime temp - mean daily range)
• Pond ?t = pond maximum of 80ºF - pond minimum temperature
• Pond's allowable daily heat stored (from building), Btu/day ft^2 = (0.7) (pond ?t) (pond depth, feet*) (62.5 lb/ft^3 water)(1.0 Btu/lb ºF) (*depth not to exceed 0.75 ft) (This equation assumes 70% of the pond's daily heat gain from the building below and 30% through the insulated panels above the pond)
• Required size of pond (ft^2 pond per ft^2 floor area) building total heat gain per day = (Btu/day ft floor area) pond allowable hea 2 t t stored per day (Btu/day ft 2 floor area)
See TABLE 4 for a comparison of the design guideline and the more detailed calculations for roof ponds.
The residence in FIG. 22 is one of the first roof-pond structures. Located in Atascadero, California, at about 35º N latitude, it has a remarkable history of thermal stability, providing both passive solar heating in winter and passive cooling in sum mer. Roof-pond inventor Harold Hay donated the building to California State Polytechnic at San Luis Obispo in the late 1990s. To emphasize the pond as the solar heating device, this house has almost no south-facing glass (most windows face east toward a small lake). The sliding insulation panels are stacked when open (by day in winter, by night in summer) over the carport on the north end of the building.
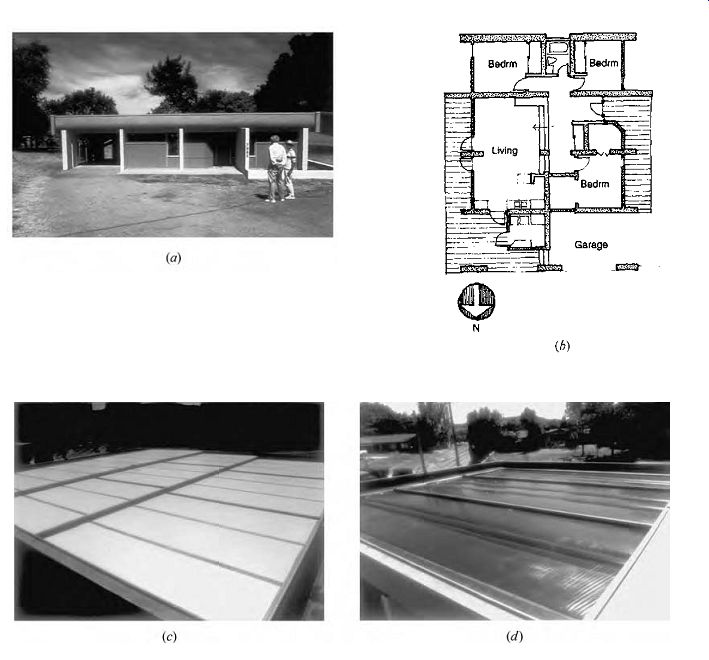
FIG. 22 One of the first roof pond buildings, this Atascadero, California,
residence is now a research building for California State Polytechnic University
at San Luis Obispo. (a) The exterior from the west. (b) Plan. South exposure
is minimal; the roof is the surface of interest for heating and cooling. (c)
The roof insulating panels in the closed position (as on a summer day). (d)
The roof insulating panels in the open position (as on a summer night). Water
is contained within plastic bags laid directly on the metal deck ceiling. (e)
Sections showing summer day roof pond insulation and night exposure. (f) Sections
showing winter day roof pond exposure and night insulation. (g) Year-long record
of the indoor temperature range compared to the outdoor range. (Drawings based
in part on Sandia National Laboratory, Passive Solar Buildings: A Compilation
of Data and Results, SAND 77-1204, 1977.)
(g) Earth Tubes
These provide a way to cool outdoor air before it enters a building. A fan is used to force sufficient quantities of air through these long tubes. Because earth tubes need to be well underground as well as rather long in order to cool outdoor air, it is rarely economical to install enough earth tubes to completely meet a building's need for cooling. If long trenches are needed for another purpose (under ground water lines, for example), an earth tube is more feasible. Where earth tubes are considered, the component of building heat gain that is represented by cooling fresh air can sometimes be mitigated using this strategy.
The estimate of cooling for the earth tubes described in FIG. 23 is based on Abrams (1986), who assumed a soil conductivity equal to that of heavy, damp earth. One of the most influential variables in earth tube performance is soil conductivity, so FIG. 24 compares the cooling performance of 6-in. (152-mm)-diameter earth tubes when soil conductivity changes. Note that this design guideline presents Btu/h cooling of the outdoor air in the tube rather than total building Btu/h ft 2 (for a typical ft 2 of building floor area). Therefore, two adjustments must be made: first, find the Btu/h cooling load of the outdoor air alone; second, adjust for the difference between hotter air outdoors and cooler air desired within the building.
See Section 14(g) for a more detailed calculation procedure for earth tubes in which tube depth, soil temperature, and soil conductivity are variable. See TABLE 4 for a comparison of the design guideline with the more detailed calculation procedure.
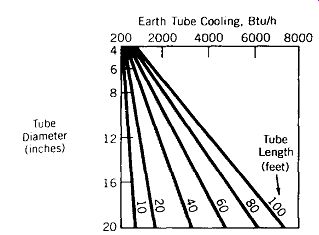
FIG. 23 Cooling of intake air provided by an earth tube in Btu/h. This tube
is set in heavy, damp soil (k = 0.75 Btu/h ºF ft) whose temperature around
the tube is 65ºF. The outdoor air entering the tube is at 85ºF and is moved
at a flow velocity of 500 fpm.
TABLE 4 compares the design guidelines for passive cooling with the more detailed calculation procedures that are given in Section 7 (basement walls and floor) and later in Section 14.
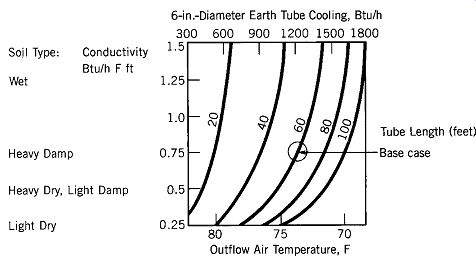
FIG. 24 Six-inch-diameter earth tube cooling capacities as soil conductivity
varies. The base case is a 6-in.-diameter earth tube 60 ft long, shown in FIG. 23 to deliver 1200 Btu/h of cooling at soil conductivity of 0.75, with other
conditions as specified in FIG. 23.
7. REINTEGRATING DAYLIGHTING, PASSIVE SOLAR HEATING, AND COOLING
At this point, preliminary investigations of envelope component U-factors and fenestration/floor area ratios have proceeded through various codes, standards, and design guidelines. It is quite likely that conflicting advice has resulted. Depending on the location, building type, and client's objectives, a very different mix of glass, insulation, and thermal mass could result from prescriptive conservation approaches compared to a passive solar heating focus or any of several approaches to passive cooling.
When prescriptive standards (such as those presented in Table G.1) appear to preclude either passive solar heating or passive cooling strategies in a building, the designer should remember that there are procedures for either window area trade-offs (in which more insulation in walls or roofs might allow more glass area) or methods to compare whole building annual energy consumption that can demonstrate the superiority of using well-designed passive strategies over a simple conventional pre scribed approach.
8. CALCULATING WORST HOURLY HEAT LOSS
Section 7 showed how heat is exchanged by transfer through a building envelope (q) and through ventilation of a building (qv). By combining these rates of heat exchange, we can obtain a building's total hourly heat loss in winter. (To calculate the total hourly heat gain in summer, other gains must be added; this more complicated procedure is discussed in Sections 11 and 13.) The total hourly heat loss of a building can be calculated under several different assumptions reflecting different purposes.
(a) Maximum Hourly Loss: Sizing Conventional Heating Equipment
The most typical use of q + qv is to determine the maximum amount of heat per hour that heating equipment must provide. Two important assumptions are usually made:
1. No internal heat gains (lights, people, etc.) and no solar gains are present in the building.
2. The design lowest outdoor temperature is occurring.
These are conservative assumptions that lead to the installation of heating equipment that is rarely used to capacity. Such equipment does provide a safety margin for those times when even lower than design temperatures occur or when windows are inadvertently left open or other temporary and unexpected heat leaks occur in very cold weather.
Thus, to obtain design hourly heat loss, calculate qtotal = q + qv where q = (?UA) ?t with ?UA the sum, for all exposed components of the building's envelope, of U × A; ?t = (interior temperature - exterior design temperature); and qv = 1.1V ?t (1.2V ?t; SI units) where V is the volume in cfm (L/s) of outdoor air introduced.
(b) Maximum Hourly Heat Loss: Sizing Auxiliary Heating for Passive Solar Buildings
The one important difference between the maxi mum heat loss calculations for conventional and passive solar buildings is the following assumption:
No internal heat gains (lights, people, etc.) are present, but there is sufficient stored solar energy to at least cancel out the heat losses through the south solar collection area.
Otherwise, the procedure is the same as that for conventional buildings:
qtotal = q + qv where q = ?UAns ?t qv = 1.1V ?t (?t again based on the design condition, Section B) (1.2V ?t; SI units)
?UAns
excludes the solar collector area
This can lead to occasional chilly interiors, as when several days of heavily overcast skies coincide with design-condition outdoor temperatures. In some locations, therefore, designers use the more conservative, conventional procedure for sizing the auxiliary heating for passive solar buildings.
(c) Maximum Hourly Loss: Checking Design Criteria
The calculations that produce q and qv are also useful in reviewing a building's design. By showing where most of the heat loss is occurring, they can quickly pinpoint opportunities for energy conservation and increased comfort. If much of the building's heat loss is occurring through large windows in one wall, for example, consider the following options:
1. Reduce the window size. (Architectural and daylighting considerations may override.)
2. Go to a lower window U-factor to reduce heat loss and increase the winter surface tempera ture of this large glass area. (Cost and detailing considerations may override.)
3. Add thermal shades or shutters to dramatically reduce heat loss and increase winter surface temperature. (Architectural, view, cost, and detailing considerations may override.) If much of the building's heat loss occurs through outdoor air, consider these options:
1. Reduce infiltration by tighter construction (or reduce mechanical ventilation toward the code-required minimum).
2. Add a heat exchanger between outgoing and incoming air.
These calculations can also be used to check your building against published criteria for thermal performance . Redesign of building envelopes to meet such criteria is fairly common in the early stages of building design.
(d) Hourly Rates of Fuel Consumption
When outdoor temperatures in winter drop below the building balance point (see Section 9), heating systems usually begin to operate. The hourly rate of fuel consumption depends on the hourly heat loss from the building. If the boiler (or furnace) is selected to run continuously at the outdoor, critical winter design temperature, then it will cycle (run intermittently) at higher outdoor temperatures.
The equipment, however, is selected on the basis of the maximum winter demand rate and therefore relates to the calculated heat loss at the design temperature. Sometimes your energy supplier will ask for the maximum hourly rate.

TABLE 5 Approximate Heat Values of Fuels
9. CALCULATIONS FOR HEATING SEASON FUEL CONSUMPTION (CONVENTIONAL BUILDINGS)
The following method of estimating the fuel used for space heating in a typical season best applies to residences and small commercial buildings that are skin-load dominated and not passively solar heated beyond SSF = 10%. To the extent that the combi nation of internal and solar gains can be predicted accurately, this method yields a reasonable estimate of annual fuel consumption for any building. (For passively solar-heated buildings, use instead the method given in Section 10.) Internal and solar gains make almost any building warmer than the outdoors during the heating season. The furnace (or other space heating device) is not needed until the outdoor temperature drops to the point at which these internal and solar gains are insufficient to heat the building by themselves, that is, when the heat lost through the building's skin and infiltration matches the heat gained through solar plus internal loads. This particular outdoor temperature is called the balance point; it represents the beginning of the need for space-heating equipment usage.
To estimate the annual energy needed for a building's space heating, it is necessary to know the following:
• The building's heat-loss rate (envelope and infiltration)
• The building's internal plus solar gain rate
• The building's balance point temperature
• The time period during which the outside temperature falls below the building's balance point temperature (DD)
(a) Balance Point Temperature
When a building needs neither heating nor cooling, the internal gains equal the external losses:
Qi
= balance point qtotal where Qi
= internal gains plus solar gains (Btu/h or W) balance point qtotal
= UAtotal (ti - tb) tb = balance point temperature ti
= average interior temperature over 24 hours, winter UAtotal
= total heat loss rate-envelope plus infiltration (Btu/h ºF or W/ºC) Rewriting this equation to solve for the balance point temperature:
tb = t Q UA i i
total
To determine the total heat loss rate UAtotal , combine the envelope (or skin) losses and the infiltration (or ventilation) losses.
The quantity Qi cannot be determined so straightforwardly. The internal gains can be estimated as shown in Table F.3 (remember, these are summertime gains) or calculated more precisely from known building population, lighting, and equipment data. For residences, the following daily total internal gains are considered typical:
People: Two adults and two children (average times of occupancy): 23,000 to 24,500 Btu/day (6.7 to 7.2 kWh/day) Lights and equipment: See TABLE 6 for individual heat sources, but if actual appliances are unknown, then:
53,000 Btu/day (15.5 kWh/day) for standard efficiency equipment
100,000 Btu/day (29.3 kWh/day) for old and inefficient equipment
For more details on internal gains in residences, see the 2009 ASHRAE Handbook-Fundamentals, Section 17.
The solar gains are elusive; each month has a different average gain. For simplicity in the heating season, use the average January daily insolation on a vertical surface (found in Section C) with this approach.
During the heating season:
Qi = internal gains (Btu/day) 24 h + January insolation area (ft ), (Btu/ft da 2 2 y y average), south vertical surface glass

TABLE 6 Typical Residential Daily Internal Heat Gains from Appliances and
Lighting
The balance point temperature, tb, can be used to do several things besides predict fuel consumption. By noting the tb on a graph of monthly out door temperatures, the designer can quickly see the relative importance of heating versus cooling for a specific building in a given climate. Also, it can be used to gain a better understanding of how zones in a building interrelate. Once the tb is calculated for each zone, it can be determined when the entire building needs heating (outdoor temperature below any zone's tb) or cooling (outdoor temperature above any zone's tb), or when one zone's surplus heat can be another zone's space-heating source (outdoor temperature higher than one zone's tb but lower than that of another). If thermal exchange between zones occurs for a major portion of the typical year, the choice of either a heating or a cooling strategy could be influenced.
(b) Degree Days (DD)
These data are published for each climate station and are calculated to various base temperatures. Heating degree days (HDDs) to a specified base temperature, such as HDD65, refer to average daily temperatures below the base temperature of 65ºF. Cooling degree days (CDDs) to a specified base temperature, such as CDD50, refer to average daily temperatures above the base temperature (of, say, 50ºF). (Climate data previously showed cooling degree hours [CDH], such as CDH74, referenced to the average number of hours above a base temperature of 74ºF. These data appear to have been generally displaced by CDD data.) For smaller buildings, such as residences, HDDs are in much wider usage than are CDDs (or CDHs), and many data sources simply list DD65; this notation is interchangeable with HDD65. Until recently, degree days were always based on 65ºF, because older, indifferently insulated buildings, with low internal gains, had a typical balance point of about 65ºF. The combination of much higher levels of insulation and much more electric equipment has shoved the average building's balance point temperature downward; hence DD50, DD55, and DD60 are included with the traditional DD65 in Section C.
To derive HDD for a particular climate and X base temperature (HDDX), each day's mean temperature (halfway between high and low) is subtracted from the base temperature; the result is the number of HDDX for that day. If the mean tempera ture equals or exceeds the base temperature, no HDDX are recorded. Then the HDDX are totaled for an average year.
For example, assume that a day in Troy, New York, had a high of 60ºF and a low of 34ºF. The mean temperature was (60 - 34/2) + 34 = 47ºF.
65 - 47 = 18 DD65 60 - 47 = 13 DD60 55 - 47 = 8 DD55 50 - 47 = 3 DD50
Clearly, a building with a 65ºF balance point will need more heat on a given day than will a building with a 50ºF balance point temperature.
To convert DD I-P to DD SI, simply multiply DD I-P by 0.56:
DD SI = 0.56 DD I-P

TABLE 7 Some Typical Values of Annual Fuel Utilization Efficiency (AFUE)
To obtain the DD balance point needed to estimate a particular building's heating needs, interpolate between the various base DDs as required. (If the balance point is below 50ºF, get lower DD base figures from your local weather station. Do not extrapolate!) (c) Yearly Space-Heating Energy To estimate the heating energy needed over an average year for a building, E, calculate
[...]
where E is in units of fuel consumed per year (therms of gas or kWh of electricity) UA is the total heat loss rate, envelope + infiltration (Btu/h ºF, or W/ºC) DD balance point is obtained as just described AFUE is the annual fuel utilization efficiency, displayed on all furnaces manufactured within the United States (TABLE 7) V is the heating value of the fuel from TABLE 5
10. PASSIVE SOLAR HEATING PERFORMANCE
Section 4 presents design guidelines for determining solar opening size, thermal mass, and the solar savings fraction (SSF). As a building design takes shape, more detailed information becomes useful: Which passive system matches the architectural program? Which performs better thermally? For a given solar opening, what exactly is the resulting SSF? How much auxiliary fuel consumption per year must accompany that SSF? If a building over heats on sunny winter days, how hot will it get? To this point, passive solar heating has been treated as a single approach; the design guidelines for SSF distinguished only between standard and superior system performance. Important architectural differences, however, characterize the various passive solar heating approaches, as summarized in TABLE 8. On the basis of the wider architectural implications presented in TABLE 8 and the detailed sizing information found in Section H, the designer can select a passive solar heating approach with some confidence in its applicability and its yearly need for auxiliary space heating.
(a) Glazing Performance
In the reference systems of Table H.1, the glazing is assumed to face due south. The choices of glazing conditions include single, double, and triple glazing, and night insulation "no" or "yes." Single, double, and triple glazing with no night insulation are common approaches. Movable night insulation, once common (FIG. 25), has largely been sup planted by superwindows. Yet, which of the current superwindows might provide a performance approximately equivalent to double glazing with R-9 night insulation? The 24-hour averaged U-factor of the double glazed fixed window with R-9 night insulation is found as follows: a double-glazed window, with a wood/vinyl frame, corresponds to window #5 in Table E.15, with a U = 0.49. "Night insulation" assumes adding R-9 insulation, in place from 5:30 P.M. to 7:30 A.M. This extra-insulated window should at night then have an overall R of at least (1/0.49) + 9 = R-11; then nighttime U = 1/11 = 0.09.
U24av =
(14 h)(0.09)] [(10 h)(.49) 24 h
? = 0 0.257
The equivalent superwindow would then have these characteristics, based on window #5's solar gain:
U = 0.26, SHGC = 0.58, VT = 0.57
Such a combination may be difficult to obtain.
Here are some choices for superwindow substitutes for the "double/yes n.i." option within the Section H reference types:
• Where listed, choose the triple-glazing option instead of the double/yes n.i.
• Use window #7, Table E.15, with U = 0.33, SHGC = 0.55, VT = 0.52, with nearly identical solar gain characteristics, and interpolate between double/yes n.i. and double/no n.i. on the basis of U-factors:
Double/no n.i., U = 0.49
Double/yes n.i., U = 0.26
Window #7, U = 0.33
This places window #7 at about one-third of the difference, closer to double/yes n.i.
• Use the clear triple-glazed window (#12, Table E.15) in place of double/yes n.i., and given its U = 0.34, SHGC = 0.52, VT = 0.53, interpolate for U-factor as with window #7.
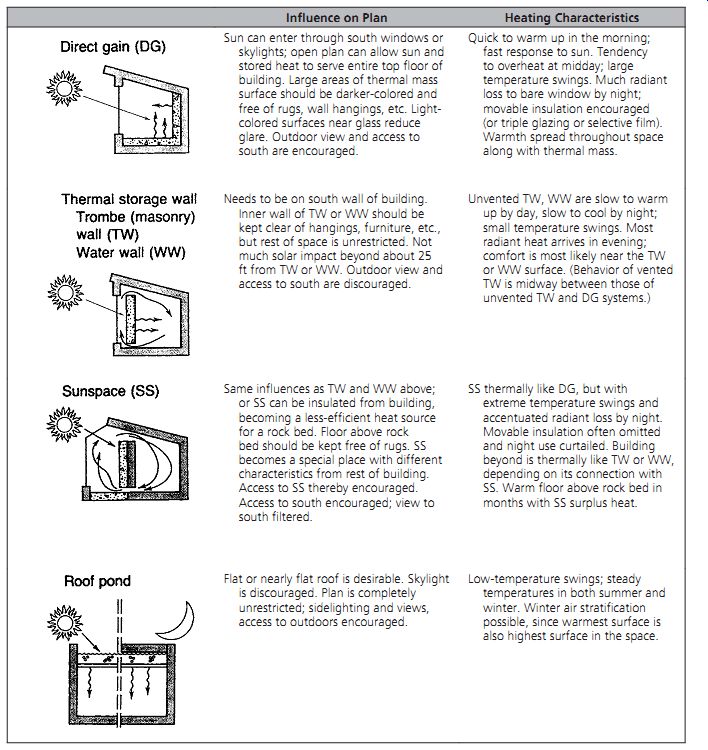
------------- TABLE 8 Passive Solar Heating Systems Compared
Influence on Plan Heating Characteristics Sun can enter through south windows or skylights; open plan can allow sun and stored heat to serve entire top floor of building. Large areas of thermal mass surface should be darker-colored and free of rugs, wall hangings, etc. Light colored surfaces near glass reduce glare. Outdoor view and access to south are encouraged.
Quick to warm up in the morning; fast response to sun. Tendency to overheat at midday; large temperature swings. Much radiant loss to bare window by night; movable insulation encouraged (or triple glazing or selective film). Warmth spread throughout space along with thermal mass.
Needs to be on south wall of building.
Inner wall of TW or WW should be kept clear of hangings, furniture, etc., but rest of space is unrestricted. Not much solar impact beyond about 25 ft from TW or WW. Outdoor view and access to south are discouraged.
Unvented TW, WW are slow to warm up by day, slow to cool by night; small temperature swings. Most radiant heat arrives in evening; comfort is most likely near the TW or WW surface. (Behavior of vented TW is midway between those of unvented TW and DG systems.) Same influences as TW and WW above; or SS can be insulated from building, becoming a less-efficient heat source for a rock bed. Floor above rock bed should be kept free of rugs. SS becomes a special place with different characteristics from rest of building.
Access to SS thereby encouraged.
Access to south encouraged; view to south filtered.
SS thermally like DG, but with extreme temperature swings and accentuated radiant loss by night.
Movable insulation often omitted and night use curtailed. Building beyond is thermally like TW or WW, depending on its connection with SS. Warm floor above rock bed in months with SS surplus heat.
Flat or nearly flat roof is desirable. Skylight is discouraged. Plan is completely unrestricted; sidelighting and views, access to outdoors encouraged.
Low-temperature swings; steady temperatures in both summer and winter. Winter air stratification possible, since warmest surface is also highest surface in the space.
-----------------------
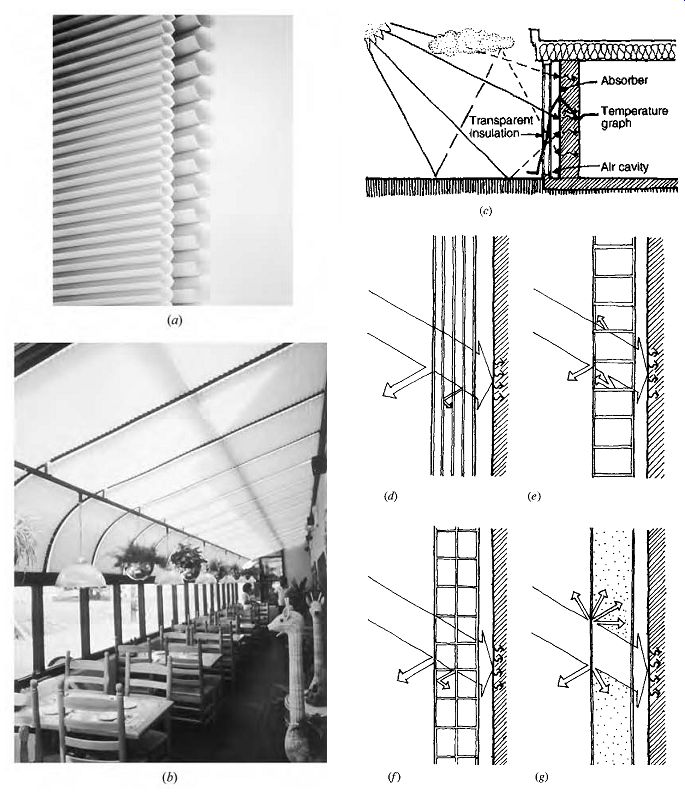
FIG. 25 Variations on insulation for solar apertures. Transparent insulation
materials (TIMs) in most applications are more translucent than transparent.
(a) The Duette window shade, when installed over double glazing, has winter
R-values as follows: at 3/8 in. (9.5 mm) thick: translucent, R 3.23; 3/4 in.
(19 mm) thick: translucent R 3.57; opaque, R 4.2. (b) The shades can move either
vertically or horizontally, cover both planar and curved surfaces, and be either
motor or manually operated. (c) These translucent materials are particularly
effective as insulation for Trombe walls, where the heated mass can be insulated
from the cold winter air temperatures yet still receive strong sunlight. (Fraunhofer
Institute, Freiburg, Germany, and Solar Today, American Solar Energy Society.)
(d) Absorber-parallel systems utilize multiple films, as in "superwindows." The
more layers, the greater the optical losses. (e) Absorber-vertical structures
include honeycomb or capillary materials. Some scattering and absorption of
light occurs, but optical losses are lower than with type (d). (f) Cavity structures
combine absorber-parallel and absorber-vertical structures. (g) Quasi homogeneous
layers are similar to cavity structures and include aerogel. (Hunter Douglas,
Inc., Broomfield, CO.)
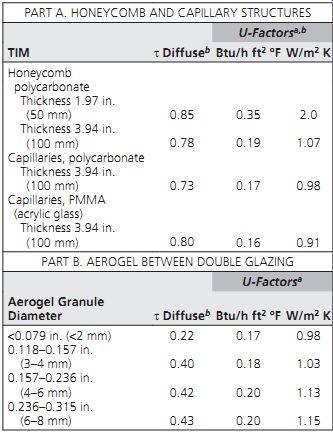
TABLE 9 Transparent Insulation Materials (TIM)
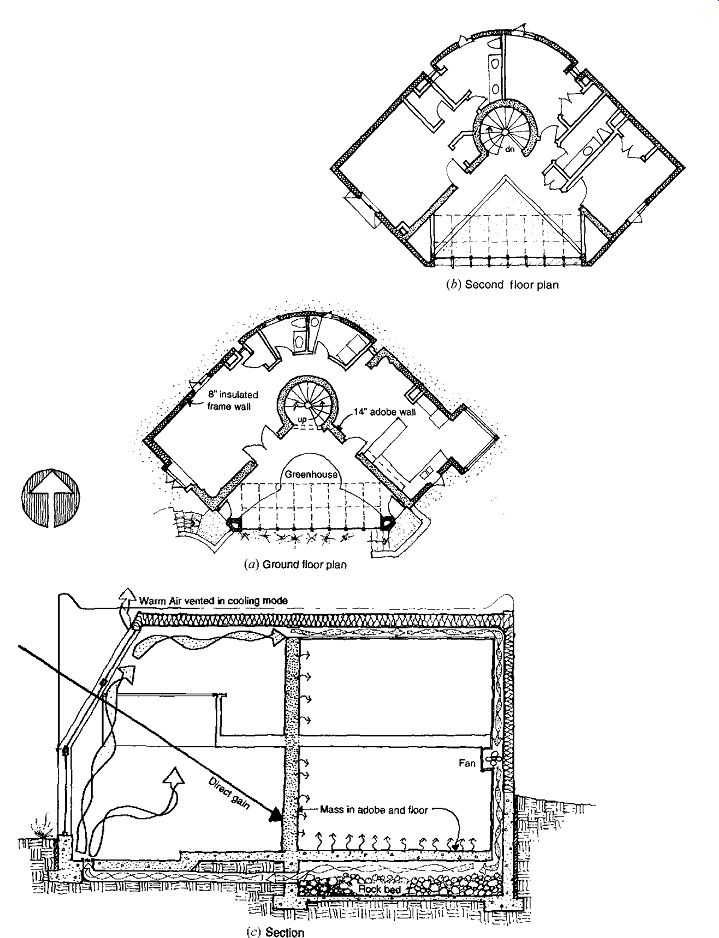
FIG. 26 An early and well-known example of sunspace passive solar heating,
Unit 1, First Village. Regularly-occupied spaces border the northeast and northwest
sides of the enclosed sunspace. (a) Ground floor plan. (b) Upper floor plan.
(c) Section showing how the hottest air from the sunspace ( midday to late
afternoon) can be forced into a rockbed below the main floor for nighttime
radiant heat.
Another option is transparent insulation materials (TIM), discussed earlier in Section 7, such as aerogel (one example). These materials transmit diffuse light and solar radiation but are opaque to thermal radiation. The four generic types of TIM are shown in FIG. 25. The absorber-parallel structures (FIG. 25a) are similar to the sheets of spectrally selective materials in superwindows; the more layers, however, the less the transmission of solar gain. Absorber-vertical structures (FIG. 25b) include honeycomb or capillary materials that reflect and transmit the incoming solar radiation with fewer transmission losses. Combining these structures (FIG. 25c) can result in either transparent rectangular cross sections or transparent foam with bubble sizes of a few millimeters. Quasi-homogeneous layers (FIG. 25g) include aerogel. These scatter the incoming sunlight differently than do the types of structures shown in FIG. 25c.
For passive space heating, TIM use may be limited by the lack of visual transparency: these materials diffuse sunlight. They are thus appealing primarily for Trombe wall and water wall applications (FIG. 25e), where the view through the glazing is unimportant. Some information on U-factors and diffuse transmittance is presented in TABLE 9.
Again, if we seek a substitute for movable insulation over double glazing, we would like U = 0.26, SHGC = 0.58, VT = 0.57; from TABLE 9, any of the honeycomb or capillary materials in Part A will be close if we remember to reduce the t diffuse and slightly increase the U-factor to account for a single cover sheet of glass.
(b) Direct-Gain (DG) Systems
These are the most commonly encountered systems because nearly all south-facing spaces have windows, and at least some have areas of internal thermal mass. In Table F.4, three of the four early solar examples utilize some DG collection. DG buildings include the Cottage Restaurant and the Oregon office in FIG. 6. The most common problems are overheating on sunny winter days and inadequate area of thermal mass.
For DG spaces, the thermal mass should be widely distributed around the room so that direct sun can strike the mass surface and/or be reflected to the mass surface as soon as possible on entering the window. Table F.2 gives design guidelines for mass; the DG reference systems (Section H) list either a 3:1 or a 6:1 mass-to-glass area ratio.
However, even more mass area will give a more thermally stable performance, as will become clear in Section 10(i); a common recommendation for DG spaces above 50% SSF is for a thermal mass area five to seven times the area of glass (for no more than the optimum 4-in. masonry thickness). There are many common ways to provide such mass surfaces, including brick veneer and clay tile over a bed of grout. These surfaces can be applied to a frame construction. Floors (such as slab on grade) are easy ways to achieve large mass areas, but carpeting and rugs are very popular with occupants.
(c) Sunspaces (SS)
These are the next most common systems, especially the prefabricated "add-on" type shown in the Kelbaugh house (Table F.4). Perhaps the most common problem is the expectation that an SS will be a greenhouse where exotic plants will thrive.
But the SS is a "thermal servant" to the "thermal master" space behind it; comfortable temperatures in the master space are achieved at the cost of very wide temperature swings in the servant space.
Consequently, while there are many times in a day when the SS is at a comfortable temperature, there are other times when it is not. In the First Village example (FIG. 26), the SS contains the stairs. Although not always thermally comfort able, the passage between floors is at least rapid and visually pleasant. The "master" spaces beyond, on both floors, can choose the degree of interaction with the SS by opening doors and windows into it.
When the SS's common wall is masonry, the conductive flow of heat from servant to master is built in. Yet many of the SS systems in Section H show an insulated, lightweight-frame common wall. It is important to remember that, with such insulated common walls, the SS is assumed to contain a row of water containers extending across the full east-west width of the SS. These theoretical containers are twice as high as they are wide and sit adjacent to (but not on) the floor and the common wall. They have a volume of 1 ft^3 for every 1 ft^2 of common wall. This takes quite a bit of SS floor area.
Both masonry and insulated common wall SS systems assume available thermo-circulation vents in the common wall; the top vents are 8 ft (2.4 m) above the bottom vents, and the top vents constitute 3% of the area of the common wall, as do the bottom vents. All SS systems are assumed to have a thermally massive, perimeter-insulated floor slab on grade.
The SS system descriptions are quite explicit as to dimensions (Fig. H.1), but variations from these dimensions are not a problem if the proportions of length-width-height are maintained. It is the shape, rather than the dimensions, of each SS type that influences its performance.
(d) Trombe Walls (TW)
These systems are considerably less common.
When used, they often have rather large DG openings within the TW for daylight and view. This is the case with the Kelbaugh house (Table F.4), an unusual example that mixes three passive systems. The main advantage of TW systems is thermal stability; the diurnal temperature swings are less than with most other passive systems. They deliver a large portion of their heat by radiation to the space. The main disadvantages seem to be the loss of view and daylight, and keeping the air space clean between the Trombe mass wall and the glass. Objects that interfere with radiant heat transfer from the interior surface must also be minimized.
Two major choices are vented and unvented.
The vented TW systems provide naturally moving air (via the stack effect between the mass and the glass) in addition to heat conducted through the mass wall. They deliver warmer air sooner than an identical-but-unvented mass wall, thanks to the flow of warmed air. They also introduce dust and dirt to the space between the mass and the glass.
The unvented TW systems deliver heat quite a bit later, with the result of quite low daily tempera ture variations and warmth arriving in the evening. They are somewhat less efficient than vented TW because the very high temperature at midday between the mass and glass results in more heat flow out through the glass.
The warehouse in FIG. 27 utilizes a very high vented TW in the New England winter. The detail shows a simple device to prevent reverse airflow at night. This Vermont warehouse utilizes ceiling fans to prevent stratification of warm air at the ceiling.
Daylighting is provided by roof monitors; the TW is vented to the outside in summer.
(e) Water Walls (WW)
These are the least common systems of all. Perhaps, as with roof ponds, this is another case of water phobia. They can be specially made, or made of corrugated galvanized steel culverts, steel drums, or fiberglass-reinforced plastic tubes (for which manufacturers provide suggested installation details). Within WW containers, some air space should be provided, as water expands when it heats. Either a rust inhibitor or a sacrificial anode should be added to the water within steel containers. Remember that WW systems should be opaque, not transparent; the more transparent the tubes, the closer to DG will be their performance. This is discussed later in Section 10(g).
Specially made WW can fit neatly below windows or anywhere else within exterior wall framing.
The San Luis Solar Group Complex includes a house and an architectural studio (FIG. 28) near Santa Margarita, California. Both buildings utilize day light (including clerestories and skylights), DG, PV, and domestic water panel collectors; there is also a small hydropower system adjacent to the complex.
Of special interest here are the WW steel panels, 9 in. (230 mm) thick and painted on the outer surface with a black selective paint behind double glazing.
The selective surface paint is an excellent absorber of short-wave solar radiation but a poor emitter of long-wave radiation from the heated black surface.
The inside steel surface is painted and exposed to the space to be heated. These WW are used in the conference room of the studio, the dining area, and the upstairs bedroom. They are unobtrusive and correspond approximately to WWC2 in Section H.
(f) Load Collector Ratio (LCR) Annual
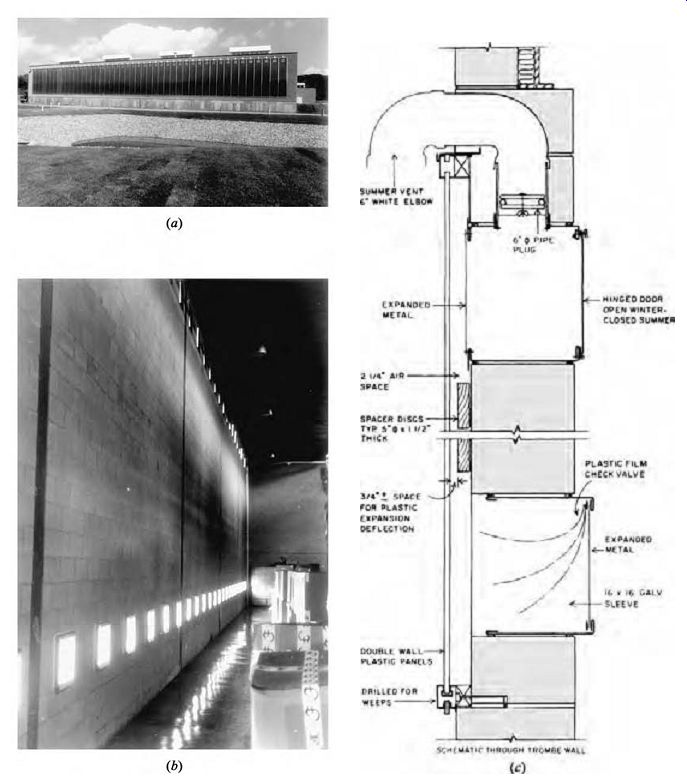
FIG. 27 The warehouse for the Famolare shoe company in Brattleboro, Vermont
(a) uses a huge vented Trombe wall, 20 ft by 184 ft (6.1 m by 56.1 m). The
Trombe wall faces 10º east of south. The pond in the foreground is an absorption
basin for rainwater from the roof and pavement. (Robert Perron.) (b) Interior
shows lower and upper vents. (c) Simple switches at the bottom prevent reverse
thermosiphoning on cold nights; seasonal switches at the top provide building
ventilation, via the Trombe wall, in summer.
Spacer disks prevent plastic double glazing from deflecting too far inward when its inner surface overheats.
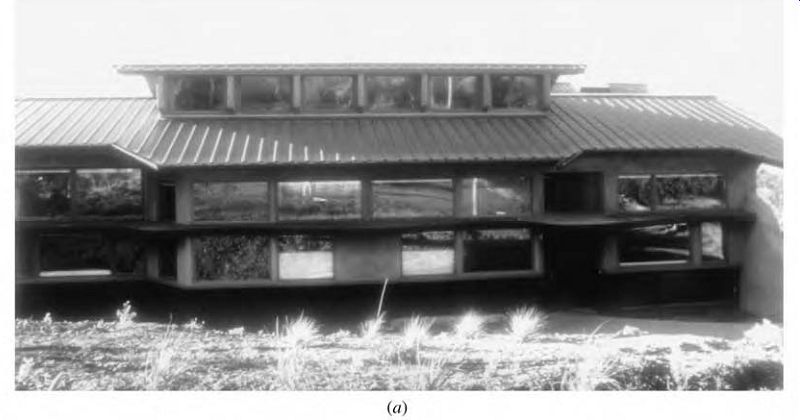
FIG. 28 The San Luis Solar Group Complex near Santa Margarita, California,
includes a house and an architectural studio. PV and micro-hydroelectricity
generation joins daylighting, passive solar heating, and passive cooling in
this innovative installation. (a) South façade of the studio. (b) Site plan.
(c) Section north-south. (d) Exterior of a specially built water wall below
a window serving the dining room.
Performance
The following procedure is based on Balcomb et al., Passive Solar Heating Analysis (1984), published by ASHRAE and reprinted by permission. The reference offers a much wider variety of passive systems and a wider network of location listings than can be presented in this book. Along with more "sensitivity curves" to allow prediction for nonstandard passive systems, the reference also provides a much more time-consuming and detailed method for calculating the monthly SSF and auxiliary energy needs; the method presented here gives annual results only. Thus, Balcomb et al. (1984) is an important and perhaps indispensable reference for the serious passive solar designer.
The method presented here, called the load collector ratio (LCR), yields the annual SSF and auxiliary energy needs for a building. This method has the following steps:
STEP 1. Choose the location and the reference passive system that most closely coincide with your building and its site. The locations listed in Appendices C and H are shown in Fig. C.1; the reference passive systems for which performance data are available (Section H) are summarized in Table H.1. If your system differs significantly from the closest reference system, see Section 10(g).
STEP 2. Tentatively select a size for the solar openings, balancing the design guidelines for SSF with those for daylighting and, if applicable, for ventilation.
STEP 3. Calculate the "non-south" envelope heat loss rate, UAns, for the building design-one that excludes the solar openings but includes all other envelope losses, as well as the infiltration loss. Then multiply UAns by 24 h to obtain Btu/DD; this is called the building load coefficient (BLC).
BLC = 24 × UAns STEP 4. Check your building's overall loss rate against the criteria from TABLE 3:
Btu/DD ft = BLC floor area (ft )^2 2
Does your building envelope conserve energy sufficiently, or do you need more insulation (or less non south glass or less infiltration)?
STEP 5. Determine the vertical projection of the solar opening area AP. (For a vertical solar opening, AP is identical to the actual opening area; for a 45º inclined solar opening, AP = 0.707 actual area.) STEP 6. Find the LCR, expressed in Btu/DD ft^2:
LCR = BLC AP
STEP 7. For the reference system that most closely approaches your design, consult Table H.3 for the appropriate location. By interpolation, find the annual SSF that corresponds to your passive system's listed LCR. Note also the annual DD65 listed in this table.
STEP 8. Finally, determine the approximate annual auxiliary heating Q required:
Q = (1 - SSF) × BLC × DD
Although this quick annual-results method is based on the DD65 listed in Table H.3, it is possible to adjust Q to approximately account for higher internal gains or better-insulated envelopes. In this adjustment, use DD based on the balance point instead of DD65 in the previous equation.
STEP 9. Now compare the design guideline-predicted relationship between collector size and SSF to the actual one you have just calculated. If the SSF is smaller than you had hoped, can you decrease BLC (improve conservation) or increase collector size, or switch to another passive system with a more favorable SSF for the same LCR? If the SSF is larger, will you be happy with the increased fuel savings, or will you reduce the collector size or consider another, less-efficient passive sys tem that has some architectural advantage over the one for which you calculated SSF? Table F.4 shows approximate LCRs for four historic solar buildings.
FIG. 29 Plans and elevations of the Omaha, Nebraska, office building discussed in EXAMPLE 11.
(g) Variations on Reference Systems
A particularly wide set of choices faces the designer of DG and SS systems, in which mass distribution and glass orientation can assume thousands of different combinations. The sensitivity curves furnished in Balcomb et al. (1984) give some guidance on how a predicted SSF might vary as an actual passive system departs from a reference system.
Sensitivity curves can serve as early general design guidelines. Looking at the curves for your location, which design changes yield dramatic results, and which make little difference? The curves may also be used to adjust the SSF found for a reference design.
One passive solar example that departs radically from any reference case is the Class of 1959 Chapel at the Harvard Business School in Cam bridge, Massachusetts (FIG. 30). The glazed "suns pace" resembles system type SSA in that it is attached to (rather than set into) the building behind it. How ever, this is manifestly not the simple rectangular SS plan, and the solar aperture is divided into south east- and southwest-facing halves. The aperture AP is doubly complicated: the vertical dimension is the vertical projection of the sloping wall, whereas the horizontal dimension is the due-south projection of the plan. From Table H.1, because of the glazed end walls and masonry common wall, it comes closest to either SSA3 (standard performance) or SSA4 (superior performance). This depends upon the glazing chosen-in this case, clear double glazing with low e, air space approximately ½-in. (13-mm) thick. In Cambridge ( Boston), for a small LCR (a huge solar aperture relative to the building behind), the Bal comb reference shows:
If LCR = 25 20 15
If SSA3, then SSF = 37 41 47
If SSA4, then SSF = 55 61 69
Given the complex geometry of this SS, the safer assumption is standard performance.
Water walls are rather uncommon in buildings, despite their relatively high performance throughout Table H.3. These systems are based on opaque containers, but some designers are attracted by the idea of daylight filtering through translucent water containers. Algae growth in transparent plastic tubes, encouraged by the daylight that passes through them, is usually controlled by the addition of an algaecide to the water. Dyes may be added to change the color of daylight seen through tubes or water-filled glass block, as in FIG. 31.
FIG. 30 The Class of 1959 Chapel at the Harvard Business School is entered
(a) through a sunspace with a sunken garden. (b) South-facing glazing of the
sunspace. (c) Plan; south is about 30º east of the point of the sunspace. (d)
Section. This is not a typical sunspace type from Section H.
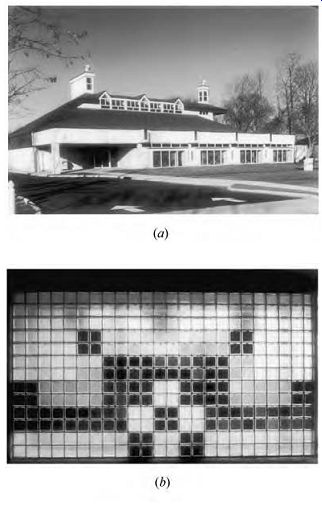
FIG. 31 The Center Moriches Free Public Library ( Long Island, New York)
utilized water-filled glass block as a heat storage and daylight-diffusing
south wall (a). Because the water storage is translucent, it functions somewhere
between a DG and a WW system. Dyes add color to selected blocks, forming the
pattern shown (b). Light shelves and stack ventilators add to its energy conserving
performance.
The "WW" of this Long Island library is actually a hybrid between DG (light passes through the glass to strike massive surfaces beyond) and WW (all light is converted to heat within the opaque water containers, then passed to the space beyond). To assess the performance of such a system, interpolate between the entire aperture considered as the relevant DG system and the same entire aperture considered as the relevant WW system. The higher the visible transmittance, the closer to DG performance will be the result.
(h) Thermal Lag through Mass Walls
The time necessary for solar heat to pass through various thermally massive materials is shown in TABLE 10. This time lag can be put to use when the time of maximum solar heat is different from the time of maximum internal heat need. A typical example is for a residence's living room in winter, in which the late evening sedentary entertainment hours occur with cold temperatures outside, yet maximum warmth is desired inside. A Trombe wall, for instance, made of solid grouted concrete block and 12 in. thick, will delay the arrival of maxi mum solar gain to the interior by almost 8 hours. If maximum solar heat gain occurs at about 1:00 P.M. (maximum sun at noon but highest temperatures at about 2:00 P.M.), then such a TW would deliver the maximum heat to the inner surface at about 9:00 P.M.
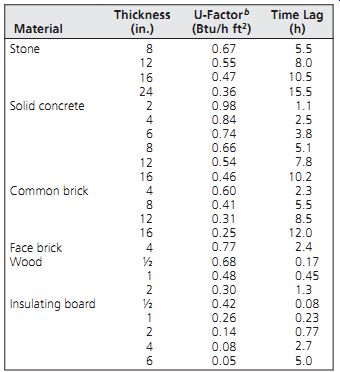
TABLE 10 Time Lag through Homogeneous Walls
(i) Internal Temperatures
Two quantities are of particular interest to passive solar designers. How much higher, compared to the outdoor temperature, will the average indoor temperature be from solar heating alone? Also, how widely will this internal temperature vary (swing) on a clear winter day?
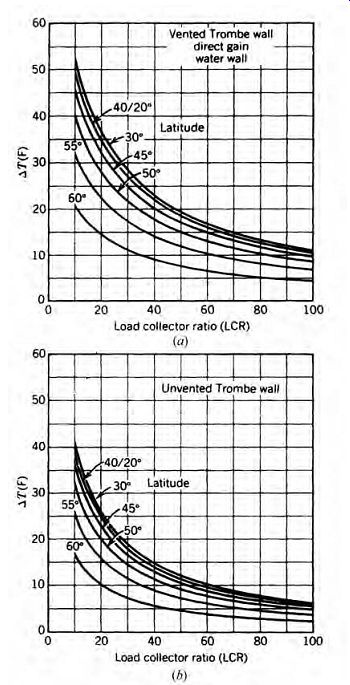
FIG. 32 Graphs of ?t solar, the temperature difference to be expected between
the average inside temperature and the average outside temperature on a clear
January day. The curve marked "40º/20º" applies to both 40º latitude
and 20º latitude. (a) ?t solar for direct gain, water wall, vented Trombe wall,
or sun space (insulated common wall) systems. (b) ?t solar for unvented Trombe
wall or sunspace (masonry common wall) systems.
The approximate temperature difference between inside and outside on a clear January day, called ?t solar, can be estimated from FIG. 32; it varies with latitude and with the LCR. Sunspaces are not shown in the figure. Although the tempera ture within an SS cannot be easily approximated, the ?t solar for the room beyond the SS can be approximated by using FIG. 32a, if these spaces have an insulated common wall, or FIG. 30b if they have a masonry common wall.
To determine the average winter indoor temperature:
1. Find the average January ambient (outdoor) temperature, TA, from Section C.
2. Find ?t solar for the building and its site (FIG. 32).
3. Find the ?t due to internal heat sources:
?t internal =
total internal gains (Btu/day) B BLC + ( 24) s UA ×
where UAs is for the solar area only.
Note: ?t internal averages 5 to 7Fº for residences.
4. Add the quantities from the first three steps to find the average January clear-day indoor temperature.
When internal gains are high, there is less need for ?t solar; the building is mostly "heating itself" (becoming an ILD rather than an SLD building). If the average indoor temperature is too high, smaller solar openings should be considered, unless the climate is predominantly cloudy (clear days rare) in November through January.
The other important comfort question concerns the size of the temperature swing due to passive solar heating. Controlled by the sun and by the actions of users rather than by a thermostat, passive solar buildings typically experience larger daily variations (swings) in indoor temperature than do conventional buildings, especially on clear days. To estimate your building's clear-day January temperature swing, or ?t swing, see TABLE 11. The aver age indoor temperature determined previously will fall in the middle of this ?t swing.
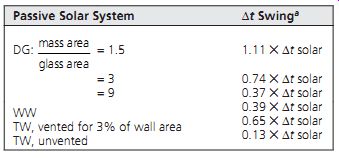
TABLE 11 Indoor Temperature Swing, ?t Swing
11. APPROXIMATE METHOD FOR CALCULATING HEAT GAIN (COOLING LOAD)
Unlike the calculations for winter worst-hour heat loss, which simply assume nighttime conditions and few if any internal gains, summer worst-hour heat gain calculations are very complex. The difference in air temperature between inside and outside, which was so influential in winter, is much less important in summer. Solar gains and internal gains from lights, people, and equipment must be included.
Summer calculations are complicated further by the fact that the hourly change in summer load can be very great, both from changing sun position and from changing internal loads. Also, in summer the thermal mass of the building becomes influential, delaying the impact of the radiant component of heat gains from all sources. The design guideline approach represented in Table F.3 cannot respond to hourly changes or to thermally massive construction. Furthermore, Table F.3 deals only with sensible heat gains and ignores latent heat gains.
Sensible heat is the kind of heat that increases the DB temperature of air; the glowing coil of an electric range adds sensible heat to the air of the kitchen.
Latent heat is the kind of heat that is present within increased moisture in air; boiling water in a pan on top of an electric range is evaporating, and as it evaporates it increases the latent heat in the kitchen air. This latent heat will increase the WB temperature, but not the DB temperature, of the air.
In conventionally cooled buildings, the mechanical cooling equipment must be sized so that latent as well as sensible heat will be removed.
A simplified heat gain procedure has been developed for residential buildings; with some risk and some judgment, it can also be used for a quick approximation of the conditions in commercial buildings. This simplified method was devised to be used with buildings that, like residences:
1. Are occupied and air-conditioned (internal temperatures closely controlled) for 24 hours per day. (Separate calculations can be done for weekdays and weekends.)
2. Derive much of their gains through the building envelope and ventilation rather than internally.
3. Can accept the effects of undersized cooling equipment, with the result that unusually hot weather means noticeably higher indoor temperatures (and that interior temperatures will vary during a typical summer day).
Because many commercial buildings do not have these characteristics, this method should not be applied if very accurate estimates are desired for such buildings. However, the method is rapid, if risky.
(a) Gains through Roof and Walls
The sensible heat gains through opaque parts of a building's envelope are calculated with the equation:
q = U × A × DETD
where U-factors are for summer
A = area of the roof or wall DETD (design equivalent temperature difference) values are listed for broad categories of construction in Table F.5 The DETD values are based on an average indoor temperature of 75ºF (23.8ºC), and the outdoor conditions listed. Note that for lightweight wall construction (and doors) the DETD varies by orientation. A means of correcting DETD for other temperatures is as follows.
Where the design temperature difference (out door design temperature minus assumed indoor temperature of 75ºF [23.8ºC]) is not an even increment of 5Fº (2.8Cº), the equivalent temperature difference should be corrected 1Fº (0.5Cº) for each 1Fº (0.5Cº) difference from the tabulated values.
For rapid approximation, however, select the DETD directly from the table for the conditions nearest to your building/climate combination.
The design temperature for your climate is listed in Section B.
Note that Table F.5 lists considerably higher DETD values for roofs than for any other component. This is due to the sol-air temperature, the effective temperature of outdoor air just above a solar-heated surface. When the sun strikes the surface, it adds its heat to that from the outdoor air.
The darker the surface, the greater the resulting effective (sol-air) temperature. This elevated outdoor temperature thus increases the ?t through the roof, resulting in greater heat gains.
The sol-air formula was discussed in Section 7.
Sol-air temperature is discussed in detail in the 2009 ASHRAE Handbook-Fundamentals, Section 18. Uninsulated or poorly insulated roofs of darker colors are particularly impacted by sol-air temperature.
(b) Gains through Glass
The quick way to approximate these gains is
q = A × DCLF
DCLF (design cooling load factor) values are listed in Table F.6 and include the U-factors as well as the equivalent temperature differences. (These DCLF values do not correspond to the worst-hour gains; they were obtained by averaging the hours from 5:30 A.M. to 6:30 P.M. at both 30º N and 40º N latitudes.) Again, the DCLF values were based on an inside temperature of 75ºF (23.8ºC) and out side temperatures as listed in Table F.6. (For rapid approximation, ignore the corrections procedure shown in note a.) Glass protected by exterior shading devices that exclude all direct sun may be considered equal to the values listed in Table F.6 for "north glass protected by awnings."
(c) Gains from Outdoor Air
In residences, outdoor air often enters by infiltration. In many other buildings, codes require the deliberate introduction of outdoor air by mechanical ventilation. Whichever way outdoor air enters your building in summer, its sensible heat gain can be calculated by either q infiltration = (A exposed) (infiltration factor) where A exposed is the total area of exposed wall surface, including windows and doors, and the infiltration factor is found from Table F.7, or q mechanical ventilation = (Q) (ventilation factor) where Q is the volume of outdoor air (cfm or L/s; see Section 7), and the ventilation factor is found from Table F.7. Latent loads will be addressed later.
(d) Gains from People
Only the sensible gains are tabulated, because a simple overall factor for latent gains is included later.
The rate of heat gain from people in various activities is shown in Table F.8; values in the "Sensible Heat" column are generally used. (For residences, sensible heat gain per occupant is often assumed at 230 Btu/h [67.3 W]):
q people = (number of occupants) × (sensible gain per occupant)
(e) Gains from Lights
The power supplied to electric lamps (those that normally are on while cooling equipment is functioning) can be added directly to the sensible heat gain. Be sure to include ballast heat gains along with fluorescent lamps, usually done by taking from 1.12 to 1.2 times the total bulb wattage of such lamps (use the lower figure with energy-efficient ballasts).
(f) Gains from Equipment
In residences, a standard assumption is that 1200 to 1600 Btu/h (350 to 470 W) of sensible heat gain is produced by appliances. (Other residential heat loads are assumed to be vented.) For other buildings, see the gains of specific pieces of equipment given in Tables F.9 and F.10.
(g) Latent Heat Gains
These vary a great deal with the type of occupancy, but this simple method assumes that the latent gains are closely associated with outdoor air infiltration. FIG. 33 is a method to estimate additional latent heat as a percentage of total sensible gains. The design DB and mean coincident WB temperatures from Section B, as well as the relative tightness of building construction, determine the latent percentage of total sensible gain. A minimum of 10% and a probable maximum of 30% additional latent are recommended limits.
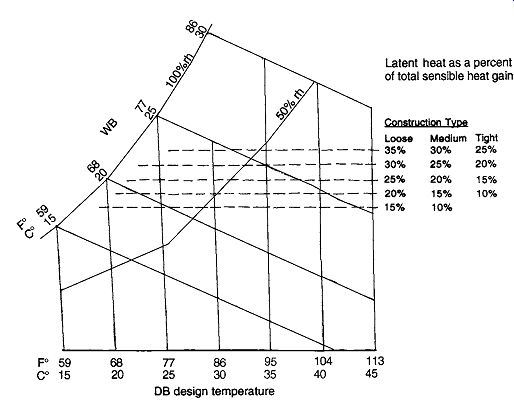
FIG. 33 Estimating latent heat gain as a percentage of total sensible heat
gain, assuming that these additional latent gains are closely associated with
outdoor air infiltration. Relative tightness of building construction is included
as a variable. Design DB and mean coincident WB temperatures may be found in
Section B.
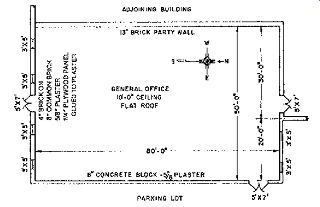
FIG. 34 Plan of the office building for which heat gain calculations are
shown in EXAMPLE 13 (and in TABLE 12). (American Society of Heating, Refrigerating
and Air-Conditioning Engineers, Inc. from the 1997 ASHRAE Handbook-Fundamentals.)
12. PSYCHROMETRY
Moisture, air, and heat interact with some consequences that are threats to, and other consequences that are opportunities for, building performance.
In winter, condensation within insulation due to falling air temperatures can be disastrous. In summer, adding moisture to hot, dry air can lower its DB temperature while raising its humidity to more comfortable levels.
These moisture, air, and heat interactions are complex. As air temperature rises, its capacity to hold moisture rises also, and the warmer air becomes less dense. These combined interactions are described by psychrometry, the study of moist air. Fortunately, these interactions can be combined within a single chart-see Fig. F.1 (I-P units) and Fig. F.2 (SI units).
In Section 4, we encountered the terms dry bulb (DB), wet-bulb (WB), and relative humidity (RH). These elements are combined in the schematic chart of FIG. 35, where the term saturation line, at 100% RH, is introduced. This is also called the dew point (DP) because dew forms (water vapor condenses) when saturated air touches any surface at or below the air's dew point temperature. This saturation is sometimes undesirable, as within walls or roofs, or on ceiling, air duct, or glass surfaces. However, it is often desirable, as on air-conditioner coils, where the resulting reduction of the moisture content in the air is deliberate.
The psychrometric chart may be used to graph a wide variety of processes, which are summarized in FIG. 36. To understand these processes, we must add to the basic chart of FIG. 35. The first addition is the humidity ratio, which indicates the amount of moisture by weight within a given weight of dry air. Air treatment processes that travel along these horizontal lines of constant humidity ratio (FIG. 37) are the familiar processes of simple heating (air passing through the heating coil of a furnace or through a solar collector) and simple (sensible) cooling (air passing through the cooling coil of an air conditioner before saturation). The humidity ratio is used in calculating latent heat gains from outdoor air.
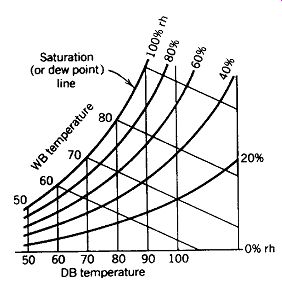
FIG. 35 Some basic components of the psychrometric chart: DB and WB temperatures
and RH.
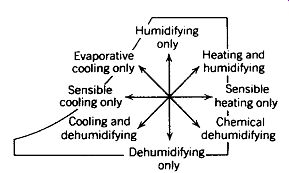
FIG. 36 Climatic-conditioning processes expressed on the psychrometric chart.
("Architectural Design Based on Climate," by M. Milne
and B. Givoni, in Watson [ed.], Energy Conservation in Building Design.)
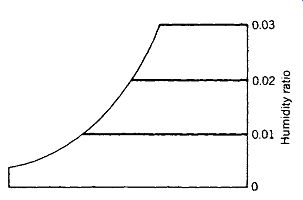
FIG.
37 Humidity ratio on the psychrometric chart: I-P units are lb moisture/lb
of dry air; SI units are kg moisture/kg dry air.
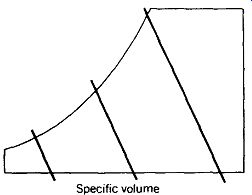
FIG. 38 Specific volume on the psychrometric chart: I-P units are ft 3/lb
dry air; SI units are m3/kg dry air.
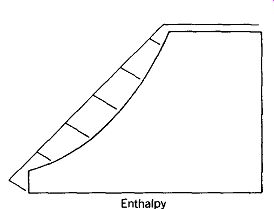
FIG. 39 Enthalpy on the psychrometric chart: I-P units are Btu/ lb; SI units are kJ/kg.
The next addition shows how the density of air varies as its temperature and moisture content vary.
These lines are those of specific volume, the reciprocal of density, a useful quantity in air-conditioning calculations and helpful in understanding the stack effect (Section 14b). The specific volume is given in ft^3/lb (m^3/kg) of dry air. From these lines in FIG. 38 it can be seen that a pound of hot air is larger (has more volume) than a pound of cold air. This larger volume per unit of weight increases buoyancy; thus, hot air rises, whereas cold air sinks.
The next addition (FIG. 39) involves enthalpy, the sum of the sensible and latent heat content of an air-moisture mixture relative to the sum of the sensible and latent heat in air at 0ºF (0ºC in SI units) at standard atmospheric pressure. Enthalpy units are Btu/lb (kJ/kg) of dry air. Enthalpy lines are almost parallel to those of WB temperature. Per haps the most familiar process to travel along the lines of constant enthalpy is evaporative cooling, where increased moisture and lower air DB temperature are obtained without changing the enthalpy (total heat content) of the air. There is indeed a drop in sensible heat as the temperature drops, but this is matched by an increase in latent heat as the moisture content increases. The opposite pro cess is chemical (desiccant) dehumidifying, where decreased moisture content is obtained at the price of increased air DB temperature; again, no change in enthalpy (total heat) occurs.
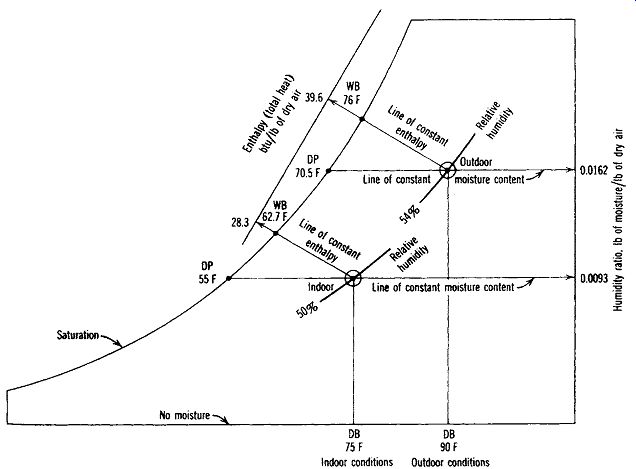
FIG. 40 Use of the psychrometric chart to determine the change in enthalpy
between given outdoor and indoor conditions.
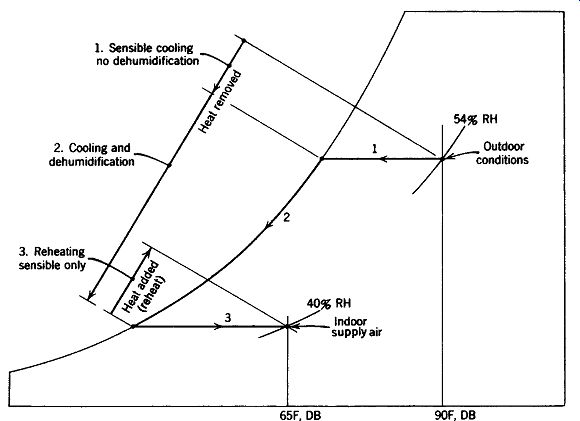
FIG. 41 Process of cooling and dehumidifying outdoor air, summer conditions.
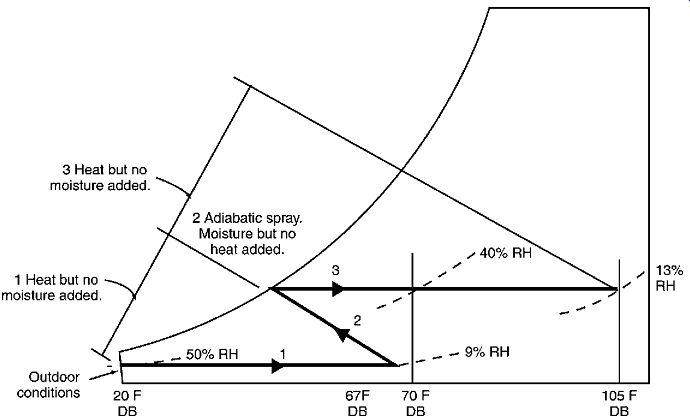
FIG. 42 Process of heating and humidifying outdoor air, winter conditions.
(a) Cooling Process
The work to be done by mechanical air-conditioning equipment is measured by the total change in enthalpy that must occur within the air that is treated by such equipment. The psychrometric chart is used to size an air conditioner accurately.
First, consider the problem of determining the total change in enthalpy. Assume outdoor conditions of 90ºF DB and 76ºF WB, with desired indoor conditions at 75ºF DB and 50% RH. From Fig. F.1, these indoor conditions are 75 DB/62.7 WB. In the simple (but relatively rare) case of cooling 100% outdoor air, the total heat to be removed is determined as shown in FIG. 40. (Once-through systems cooling 100% outdoor air require substantial energy. They may be found in hospital surgical rooms and laboratories with many fume hoods.) How much total heat will be removed in taking air from 90 DB/76 WB to 75 DB/62.7 WB?
For every pound of "dry" air (based on the weight of the air alone) that is cooled and dehumidified, 39.6 - 28.3 = 11.3 Btu must be extracted.
Similarly, for every pound of air so treated, 0.0162 - 0.0093 = 0.0069 lb of condensed moisture must be disposed of.
The actual cooling process is more complex, as shown in FIG. 41. The conditioned air must be introduced to the space at both a lower DB tempera ture and lower RH than the desired indoor conditions so that such supply air can "soak up" heat and moisture, then leave through the return air grilles no worse than the desired indoor conditions (75 DB/50% RH). So another set of conditions, lower in DB and RH, will be established, depending on the rates at which air is introduced and the amounts of heat and moisture to be absorbed by the air passing through the space.
Within the cooling equipment, the outdoor air follows a complex path; the lines labeled 1, 2, and 3 in FIG. 41 trace the cooling and dehumidifying steps. Outdoor air is cooled without a loss of moisture (step 1) until it reaches saturation (its dew point). The cooling then continues; the air continues to lose sensible heat in step 2, and now loses moisture as well, extracting more heat. When step 3 begins (known as the reheating process), the remaining smaller amount of moisture and the air are both heated to 65ºF, 40% RH-slightly below the conditions to be maintained in the space. The changes in the heat and moisture content of the air at the various stages are measured along the enthalpy scale.
Deliberately adding heat to just-cooled air should sound wasteful. Many heat-recovery processes can be incorporated in cooling systems so that necessary reheat is provided by heat removed by another process. Heat-recovery equipment is discussed in Section 5.
(b) Heating Process
The process of heating outdoor air in winter is charted in FIG. 42. Air at low temperatures in winter often has a humidity ratio so low that the moisture content would be unacceptably low when the outdoor air is warmed (step 1). Therefore, moisture must be added. Often this is in the form of a warm water spray. However, in FIG. 42 an adiabatic spray is used-that is, involving no change in enthalpy-shown in step 2. Then, in step 3, the saturated air is warmed to a higher temperature (105ºF in this case) than the desired indoor conditions of 70 DB and 40% RH. This supply air then loses its heat to the space. Note that in this process, we start at desired indoor conditions and work backward (along step 3) to saturation, then down ward along the constant enthalpy line (along step 2) until we reach the line of constant humidity ratio of the warming outdoor air-in this case, 67ºF DB. As with cooling, the changes in heat can be read on the enthalpy scale.
13. DETAILED HOURLY HEAT GAIN (COOLING LOAD) CALCULATIONS
Ordinarily, the approximate method of calculating the peak cooling load (Section 11) is sufficient for a designer's preliminary estimates of cooling equipment size for a small building. However, much more detailed procedures are used by engineers to actually size the equipment and to assess the peak-load impact of various design options such as shading devices.
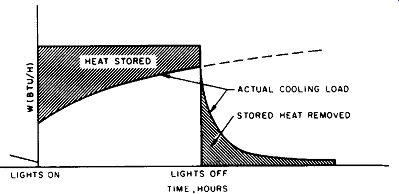
FIG. 43 Thermal storage
effect in the cooling load caused by electric lighting. ( American Society
of Heating, Refrigerating and Air-Conditioning Engineers, Inc. from the 1997
ASHRAE Handbook-Fundamentals.)
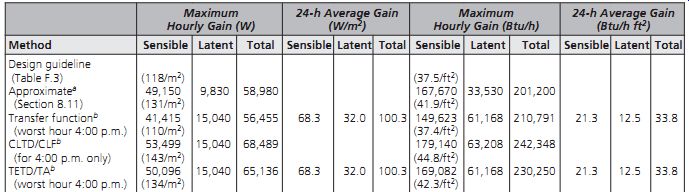
TABLE 13 Comparison of Methods of Heat Gain Calculation (EXAMPLE 13)
The 1997 ASHRAE Handbook-Fundamentals (Section 28) presents three detailed methods for calculating heat gains and equipment cooling loads.
The transfer function method (TFM) and the total equivalent temperature differential, time-averaging method (TETD/TA) both yield hourly values over a 24-hour day. They account for thermal storage by building mass, which can significantly shift the impact of instantaneous heat gains on the actual cooling load seen by the HVAC equipment, as shown in FIG. 43. These detailed methods are tedious and/or complicated enough to require the use of a computer. Another more direct, one-step method, cooling load temperature difference/cooling load factor (CLTD/CLF), more quickly yields a 1-hour value that also accounts for the effects of thermal mass; however, considerable judgment is necessary to choose the correct hour for analysis.
These methods are used by engineers, and rarely by architects, and are not presented here. However, a summary of the results of the calculations by each method for the office building of EXAMPLE 13 is shown in TABLE 13.
The quick and uncomplicated heat gain methods shown in Table F.3 and Section 11 served the simple building in EXAMPLE 13 rather well. Had the design guideline (Table F.3) been used to size a cooling system, it would have matched the TFM worst-hour sensible gains, but was only about 84% of the other methods' worst-hour sensible gains.
Latent gain estimates would have been necessary as well. The approximate method under-predicted latent gains, but the total (latent and sensible) gains of this quick, by-hand method ranged from 83% to 95% of the computer-based methods' results.
As a quick approximation for estimating the overall equipment size or passive cooling approach, these by-hand methods are adequate for smaller and simpler buildings. When utilizing these quicker methods, keep in mind that design judgment may require subdividing the calculations or even changing some of the multipliers to reflect unusual conditions. A designer's checklist of considerations for heat gain should include:
1. Characteristics of the building envelope: materials, sizes, external surface colors, and shapes
2. Building location and orientation, as well as the extent of external shading of the building by trees or adjacent structures
3. Outdoor design conditions
4. Indoor design conditions: DB, WB, and ventilation rate
5. The schedule of lighting, occupancy, equipment, and any other processes that contribute to internal heat gain
6. Thermal zoning requirements
14. PASSIVE COOLING CALCULATION PROCEDURES
When outdoor air is 85ºF (30ºC) or below, it is marginally possible to cool buildings by simple ventilation, maintaining conditions indoors that are within the adaptive thermal comfort zone. Design guidelines for sizing windows and stacks for either cross-ventilation or stack ventilation were presented in Section 6.
In the many climates in which the outdoor temperature is above 85ºF (30ºC) for a large number of working-day hours, buildings that are closed to the hot exterior during those hours are practical. Between 80ºF and 85ºF (27ºC to 30ºC), out door air can keep people within the comfort zone if air moves across the body fast enough. In areas with reliable winds, open buildings are feasible up to 85ºF (30ºC). Between 55ºF and 69ºF (13ºC and 21ºC), outdoor air is cool enough to use in place of, or to greatly supplement, mechanically cooled air if the humidity is sufficiently low. Passive cooling is even easier under these conditions; see Table F.11 for cooling data for a number of cities. Section B shows CDD50 for a wide variety of locations.
From the advent of air conditioning to recent years, the standard response of designers was to turn to mechanical cooling, utilizing the refrigeration cycle and forced air. More recently, some passive cooling alternatives have proved to be effective in climates that have clear or cool summer nights.
The following procedures go beyond the quicker design guidelines that appeared in Section 6 and allow the designer to better adjust a preliminary design to the program and the climate.
To introduce these more detailed methods, consider the United Kingdom Pavilion (now dismantled) at the 1992 Seville World Expo (FIG. 44). This was an unusually large passive building (213 ft × 105 ft × 82 ft high [65 m × 32 m × 25 m high]), with an unusually wide collection of passive cooling techniques, inspired by the traditional cooling methods of hot, dry southern Spain: shading, water, and mass. The Expo was an April to October event, with the greatest comfort challenge in July- August, when average daily temperatures range from about 64ºF to 102ºF (18ºC to 39ºC).
Shading began with the flat roof, where standing wave-form racks carried both translucent fabric shades and PV cells facing south. Outside the south façade, projecting sail-like "fly-sheets" kept off direct sun. The east and west façades used different strategies.
Water became a theme of the exhibit, beginning with the wavelike silhouette on the roof and featured as a continuous sheet of water streaming down the east façade, dripping into a pool. The water was pumped, with some power (about 50%) provided by the PV cells on the roof racks. Waiting visitors standing in line outside were treated to the sight and sound of this controlled waterfall, then crossed a bridge over the pond, flanked by spray fountains, to enter the Pavilion. The pond continued below the east wall, exposed to the interior.
Water also played a much less evident role on the west facade.
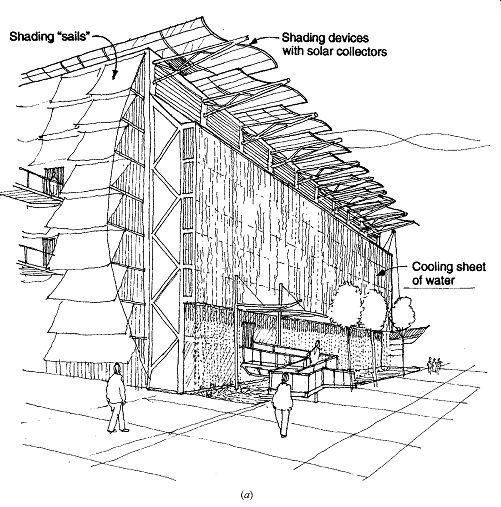
FIG. 44 The United Kingdom Pavilion at the Seville ( Spain) World Expo, 1992. (a) Waveform shading devices on the roof also carry PV cells, whose electricity
helps pump water from the pool that flows continuously over the east glass
wall. (b) Section (east-west) with a combination of cooling strategies. (c)
Section (east-west) with estimated maximum temperatures.
Mass was a particular challenge, as the building was designed as a lightweight structure to be dismantled and largely reused elsewhere. The west wall consisted of white metal containers filled with water to reflect the greater part of the direct sun and store the remainder during the day, radiating by night to cooler outdoor air.
Thermal zoning was a vital part of this concept, recognizing that people were entering from very hot, unshaded conditions and that most visitors would then move through rather quickly. Passive cooling was given the task of keeping visitors cooler than the outside; mechanical refrigeration was responsible for maintaining even lower temperatures only where people gathered over extended periods of time, as in the "pods" that contained the restaurant and the cafeteria. Gardner and Hadden (1992) describe how the typical July visitor left a sunny outdoor environment at about 100ºF (38ºC) for the cooler interior at about 90ºF (32ºC) supplemented by radiant coolth from the huge east glass wall at a maximum of 75ºF (24ºC) thanks to evaporation from the running water. Exhaust air from the pods lowered temperatures in their vicinity to about 82ºF (28ºC). The pods themselves, maintained at about 73ºF (23ºC), were entered only after the visitor underwent a lengthy transition through the Pavilion from the hot outdoors.
To some extent, both cross- and stack ventilation were also involved, despite the outdoor heat; the hottest air indoors rose to the ceiling and was replaced by outdoor air that was cooled slightly as it passed through the watery gap between the east glass wall and the pond. Very high vents at the top of both east and west walls admitted wind to sweep across the ceiling and remove the hottest air.
(a) Cross-Ventilation
Once again, remember that cross-ventilation cooling works only when the outside is cooler than the inside. Otherwise, why bring in air that is warmer to try to cool a space? For ventilation using windows, the quantity of outdoor air admitted is termed V. The flow of air from inlet windows through the building to outlet windows should have a minimum of obstacles. In I-P units,
V = C?A?
where V = volume flow rate of air, cfm
A = area of operable windows on inlet side or sides, ft^2
C? = effectiveness factor (dimensionless) that adjusts for different wind orientations: 0.5 to 0.6 for winds perpendicular to the window openings; 0.25 to 0.35 for wind diagonal to the window openings
? = velocity of wind, fpm (= mph × 88)
In SI units, V = 1000C?A? where V is in L/s (= m^3/s multiplied by 1000) A is in m^2 ? is in m/s
The sensible heat removed by this flow of outdoor air through indoor spaces was presented in Section 7:
q? = (V) (1.1) (?t)
where:
q? = sensible heat exchange due to ventilation (Btu/h)
V = volume flow rate, in cfm of outdoor air introduced
?t = temperature difference between outdoors and indoors (Fº) 1.1 = a constant (the density of air multiplied by the specific heat of air); units are Btu min/ft 3 h ºF In SI units, this becomes q? = (V) (1.2) (?t) where q? is in watts, V is in L/sec, 1.2 is a constant (the density of air [1.20 kg/m^3] multiplied by the specific heat of air [1.0 kJ/kg K]), and ?t is in K.
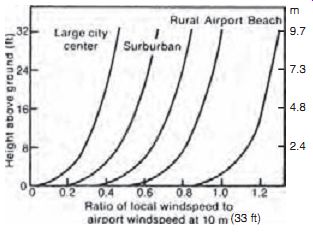
FIG. 45 Wind speed variation with height for various terrains.
(From Cooling with Natural Ventilation, Florida Solar Energy Center, published by the Solar Energy Research Institute.) (33 ft)
A further modification to these cooling formulas is usually necessary because wind data are typically taken at airports at a height of about 30 ft (10 m) above open, unobstructed ground. Rarely will buildings that rely on cross-ventilation be so favorably situated. FIG. 45 shows correction factors to be applied to such airport wind velocities for variations in terrain and height above the ground. The dimensionless correction factor should then be applied to the quantity V, usually resulting in a reduced volume flow rate.
A more detailed procedure for calculating cross-ventilation in residences given in Chandra et al. (1986) accounts for such factors as neighboring buildings and terrain, height of opening above grade, insect screens, and framing members within openings. To analyze natural ventilation in even more detail, wind tunnel tests or computation fluid dynamic (CFD) analyses are more likely to be useful than are detailed hand calculations.
(b) Stack Ventilation
This is another reminder that stack ventilation cooling works only when the outside is cooler than the inside. The stack effect needs several conditions: warmer air indoors that can enter the bottom of the stack, cooler air outdoors, and low inlets to admit that cooler outdoor air to the building. This cooler outdoor air picks up heat from the building and enters the bottom of the stack. Within the stack, this now-warm air rises, because it is less dense-there fore lighter-than the cooler outdoor air that surrounds the top of the stack.
The following equation applies when there is no significant resistance to airflow within the building.
To calculate ventilation cooling by the stack effect:
[...]
where:
V = airflow rate, cfm
K = discharge coefficient for opening; assumed to equal 0.65 for multiple inlet openings
A = in square feet, the smaller of either total free area of inlet or outlet openings or horizontal cross-sectional area (throat area) of the stack
g = gravitational constant, 32.2 ft/s^2 h = height of the stack from inlet to outlet, ft
ti = temperature indoors (>to), ºR
to = temperature outdoors (< ti ), ºR
Note: ºR = ºF + 459.67.
In SI units,
VKA ghttt ioi =2()/ -
where:
V = airflow rate, m^3/s (× 1000 = L/s)
K = discharge coefficient for opening, assumed to equal 0.65 for multiple inlet openings
A = in m^2, the smaller of total free area of inlet or outlet openings or horizontal cross-sectional area (throat area) of the stack
g = gravitational constant, 9.81 m/s^2
h = height of stack from inlet to outlet, m
ti = temperature indoors (>to), K to = temperature outdoors (< ti ), K
Note: K = ºC + 273.15.
The height of a stack and its cross-sectional area present an unusual opportunity for building form. The Inland Revenue Centre at Nottingham, England (FIG. 46), took advantage of this opportunity to provide cylindrical stair towers at corners (or at ends) of its buildings as stack ventilators. These are three- and four-story buildings, with a width of 44.6 ft (13.6 m) to encourage both daylight penetration and natural ventilation. The tower stacks serve all floors except the top. The fabric-covered top of each tower is 23 ft (7 m) above the highest floor served, and can be raised up to 3.3 ft (1 m) or lowered (closed) to vary the flow of exhaust air. The stacks are enclosed in glass block so that solar gain can assist the heating-and thus the flow-of air by day within the stack. Berry et al. (1995) report that the airflow increased from 4.8 to 6.2 ACH with the tower operating in solar mode.
Each lower floor has a 43 ft 2 (4 m^2) opening to each stack, with the openings (doors) held open magnetically unless fire alarms close them. This rather small opening to the stack (relative to the floor area served) is the limiting factor in the out ward flow of heated air; to supplement the supply of outdoor air, small three-speed fans are installed in the floor below each window to draw in fresh air, then distribute it through a wide floor grille. The triple-glazed windows are also operable, both as sliding "doors" and as tilt-ins from the top.
This fan-assisted stack effect is used on summer nights to help pre-cool the building for the following day; the lower floors feature very large areas of exposed structural mass in their precast concrete ceilings.
The top floor is a lighter-weight structure, with the stack effect culminating in a ridge vent. Monitoring reveals that this floor is usually a few degrees warmer than the massive night-ventilated lower floors.
(c) Night Ventilation of Thermal Mass
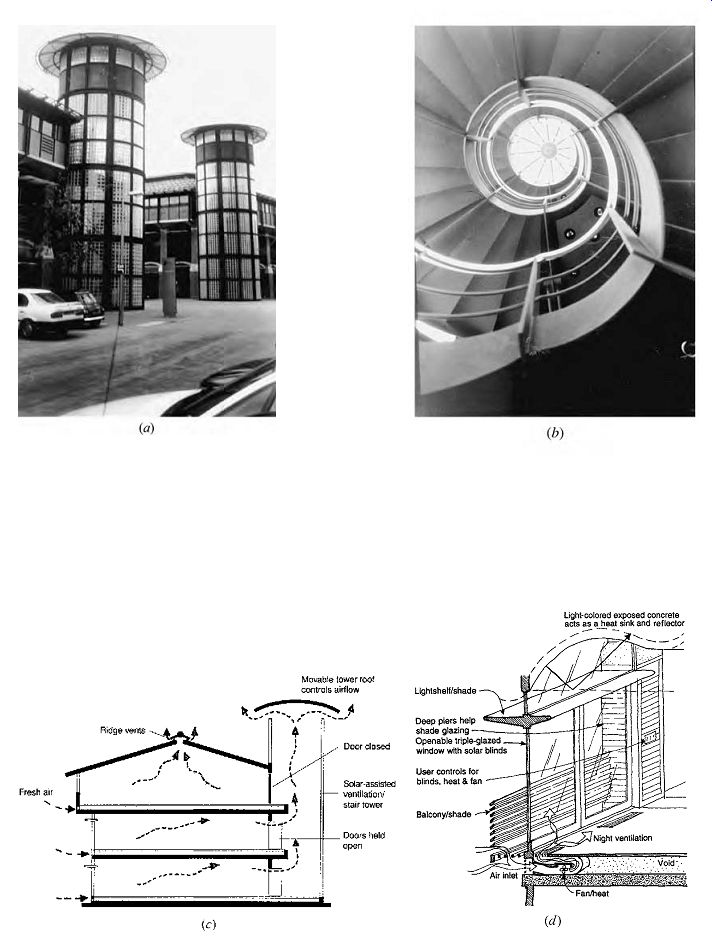
FIG. 46 The Inland Revenue Centre at Nottingham, England. (a) Cylindrical
stair towers at the corners and ends of three- and four story office blocks
act as stacks; solar gain through glass helps speed the flow of exhaust air.
(b) Tops of the towers are fabric and can be raised to increase the stack aperture
and therefore increase the flow. (c) Section of a three-story wing with a stack
ventilation stair tower. (d) Section perspective with fan-assisted intakes
below each window and an exposed precast concrete ceiling that helps store
heat for night ventilation cooling.
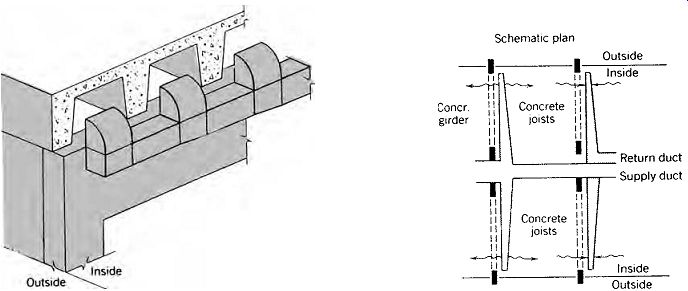
FIG. 47 Example of ductwork for night ventilation using the thermal mass
of a concrete structural system.
Before doing these detailed calculations, be sure that (1) you have checked your summer climate against the passive cooling design strategies (Fig. 4.13) and that night ventilation of thermal mass is appropriate, and (2) your building and climate have been checked for approximate performance based on the design guidelines (FIG. 16) for this cooling strategy. Also have in mind a positive night ventilation strategy; FIG. 47 shows an example of a forced-air system integral with a concrete joist-and girder structural system. The following procedure is adapted from one developed by Karen Crowther for a workshop at the Fifth National Passive Solar Conference in Amherst, Massachusetts, as presented in Miller (1980).
STEP 1. In column II of TABLE 14, list the hourly outdoor temperatures for the design condition (these may be approximated from the summer DB temperature and mean daily range). This will give the worst-day performance. (To get average-day performance, list average hourly temperatures, which are available from local weather service records.) You need not list temperatures above 80ºF (27ºC) because outdoor air will not be used for cooling above that temperature.
STEP 2. Calculate the 24-hour heat gain for the building in Btu. Find the sum of all the hourly heat gains through the envelope, the minimum ventilation while "closed," and the internal gains while operating. List on line H of TABLE 14.
STEP 3. Find the total area of the thermal mass surface that is exposed (no rugs, etc.) both to the space to be cooled and to moving night air during the ventilation ("open") cycle; list on line A of TABLE 14. Note: The larger the mass area exposed, the better the performance. This is why direct-gain solar-heated buildings, with plentiful exposed mass, often make such good candidates for night ventilation cooling. Two additional comments on mass surface: place it where people "see" it so that it can readily receive their radiant heat, and keep direct sun off the mass (and out of the building) during the cooling season.
STEP 4. Find the mass heat capacity for the entire space to be cooled: mass volume × density × specific heat. Table E.1 lists both density and specific heat for most common building materials; TABLE 15 shows a quick way to get mass heat capacities for the most common thermal mass materials. Enter this total mass heat capacity on line B of TABLE 14.
STEP 5. For "supplementary" cooling due to surfaces other than those of the principal thermal mass, list the space's floor area. This step should be taken only for spaces with a significant amount of roof, wall, or floor area in addition to the thermal mass areas counted in step 3. For example:
• If the space has exposed concrete ceilings, walls, and floors-all counted already as thermal mass-skip this step.
• If all thermal mass is in the form of free-standing water containers, enter the entire floor area.
• If the entire ceiling is thermal mass, but the walls or the floors are not, enter half of the floor area.
• If the entire ceiling is thermal mass, but the floor is not, and there are few or no walls (e.g., open office plan), enter one-third to one-fourth of the floor area.

TABLE 14 Night Ventilation of Thermal Mass

TABLE 15 Common Mass Heat Capacities
STEP 6. Complete column III hour by hour after determining the mass temperature (column IV for the preceding hour):
For the first hour, assume that the mass tempera ture is 80ºF. The surface conductance is usually assumed as 1.0 Btu/h ft 2 ºF. (See Table E.3 for other surface conductances under various conditions, many of which are considerably more than 1.0.)
STEP 7. Complete column IV, hour by hour, after calculating the cooling Btu/h (column III):
mass temp. = previous hour mass temp. (col. IV)
cooling Btu/h (col. III) mass heat capacity, , Btu/ºF (line B)
STEP 8. Continue this hourly process using columns III and IV until the falling temperature of the mass equals the rising temperature of the outdoor air. At that point, continuing with plentiful ventilation will only rob the mass of its coolth; the building therefore switches to (thermally) closed mode, with minimal ventilation.
STEP 9. Add all the hourly cooling Btu/h values (column III) to obtain the total mass cooling in Btu (line D).
STEP 10. Note the final mass temperature from column IV. This is probably at least 5Fº above the lowest air temperature of the night (column II). If this lowest mass temperature is significantly higher, consider redesigning for more exposed mass surface area.
STEP 11. If supplementary cooling is appropriate (see step 5), calculate it as follows: The factor 2.25 assumes a modest role for the other, less thermally massive surfaces. Enter this supplementary cooling on line F.
STEP 12. Obtain total cooling by adding lines D and F; enter the total on line G.
STEP 13. In step 2, you entered the 24-hour heat gain for the building on line H.
Compare this required cooling to the total cooling provided (line G). If you have not provided enough cooling, and the final mass temperature is more than 7Fº above the lowest nighttime outdoor temperature, consider redistributing the building mass over a wider surface (e.g., 3000 ft 2 of 4-in. slab rather than 2000 ft^2 of 6-in. slab) and trying again.
If you do not have enough cooling, and the final mass temperature is 5Fº to 7Fº above the lowest nighttime outdoor temperature, consider providing both more mass and more surface area (e.g., 3000 ft^2 of 4 in. slab rather than 2000 ft^2 of 4-in. slab) and trying again.
STEP 14. Determine and enter on line I the approximate flow required for night-ventilating air.
Use the following formula:
cfh=
Btu/h
0.018 ?t where
cfh (ft^3/h) = the minimum required flow rate of night air
Btu/h = the cooling Btu for the hour of maximum cooling during the night (column III)
?t = the temperature difference between the final mass temperature (column IV) and the outdoor air (column II) for that same hour of maximum cooling It is often useful to express this night ventilation flow rate in terms of ACH:
ACH=cfh required building volume (ft )^3
What might be the advantages of this approach compared to conventional mechanical cooling? FIG. 48 compares several August monthly records for the (conventional) compressors and the night-flush fans. In the first two Augusts, the building operated as a night ventilated structure. In the third August (1991) due to a building wide computer control change over, the building operated only as a conventionally cooled structure. The sun's impact on the building should be relatively equal for these 3 months but outdoor temperature varied as shown by the CDD18ºC values. Not only was as much electricity necessary to cool the conventionally operated building, despite lower CDD than the previous August but also all the fan energy use and almost all the compressor energy occurred during the daytime hours of high consumption. In many locations utilities charge more for electricity used during the daytime. With night ventilation, the fans deliver huge quantities of fresh air off-peak by night, unlike the conventional daytime operation that recycles some air to save energy.
Another night ventilation example is the California Highway Patrol offices at Gilroy, California, shown in FIG. 49. This one-story building sits near a freeway interchange south of San José. In this building, the nighttime air is drawn in as far from the freeway as possible, taken underground a short distance (with just a bit of earth tube cooling), then distributed throughout the central corridor. At either end of a continuous skylight over the central corridor, large fans exhaust air by night.
Corridor walls are concrete block, and the floor is a concrete slab on grade. The cool night air may carry a seasonal scent; Gilroy calls itself the garlic capital of the world.
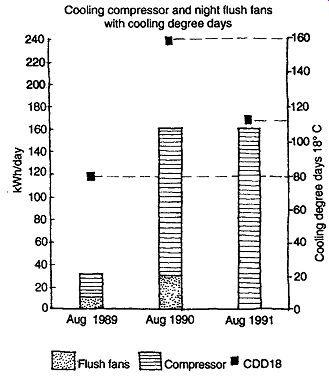
FIG. 48 Comparing night ventilation of mass with conventional compressive
cooling. The Emerald People's Utility District offices (FIG. 7 and EXAMPLE
1, Part J) are monitored for end use of electricity. In August 1991 (117 CDD65
[65 CDD18]), with compressive cooling only, 160 kW/day of electricity was used,
nearly all of it during periods of heavy use (day time). Compare this to the
hotter August 1990 (150 CDD65 [83 CDD18]), when 126 kW/day was used for compressive
cooling by day, plus 34 kW/day for night ventilation fan-forced cooling.
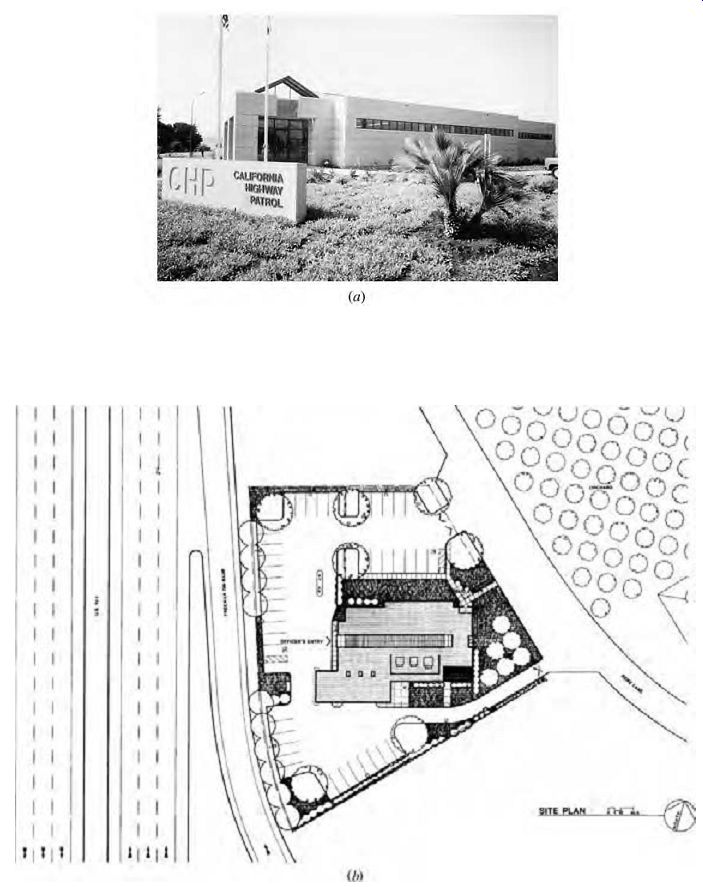
FIG. 49 The California Highway Patrol building near Gilroy, California (a)
is flushed with night air for cooling. (b) Site plan. (c) Axonometric shows
intake air through a very short earth tube; night flush exhausts are at either
end of the central skylit corridor with thermally massive walls and floor.
(d) Looking up at one night flush exhaust duct. (e) Exterior with night flush
exhaust grille. (d) Fan-Assisted Evaporative Cooling
Before beginning the following calculations, be sure that:
1. You have checked your summer climate against the passive cooling design strategies, and the evaporative cooling strategy is appropriate.
2. Your building and climate have been checked for approximate performance based on the design guidelines for evaporative cooling (Section 6d).
First, find the total sensible heat gain in Btu/h that is to be removed from your building by evaporative cooling. Generally, this is calculated at your climate's summer design DB and mean coincident WB temperatures (Table B.1). The psychrometric chart is then used to plot the progress of evaporatively cooled air, as shown in FIG. 50. (The complete psychrometric chart is given in Fig. F.1 [I-P units].)
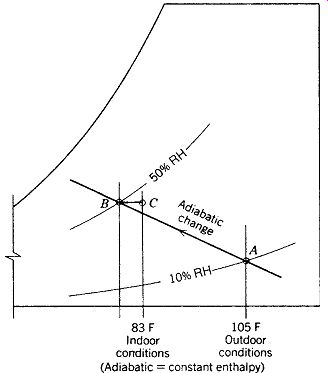
FIG. 50 Once-through cycle of outdoor air through a fan-forced evaporative
cooler. Values are transcribed from the psychrometric chart (Fig. F.1). Hot,
dry air can be humidified adiabatically (no change in total heat content) from
point A to point B, reaching indoor conditions that fall within, or close to,
the optimum summer comfort zone shown in Figs. 4.7 and 4.8. This is accomplished
without the use of the high-energy-consuming compressive refrigeration cycle.
As the humidified air picks up sensible heat from the space, it moves from
point B to point C.
STEP 1. Determine outdoor air conditions. Enter the psychrometric chart at the summer design DB and mean coincident WB temperatures for your climate (point A in FIG. 50). As the air is blown through the evaporative cooler, it proceeds along the constant WB line toward saturation or 100% RH (from point A toward point B in FIG. 50).
STEP 2. Determine supply air temperature. The most efficient evaporative cooler will be able to cool and humidify the outdoor air to a point about three-fourths of the total distance on the chart from entering air conditions to saturation (the three fourths point is reached at point B in FIG. 50); a more reasonable operating assumption may be two-thirds of that total distance.
STEP 3. Determine ?t indoors. At conditions of point B, the air leaves the evaporative cooler and enters the building. It immediately begins to pick up sensible heat (moving from point B toward point C in FIG. 50). When the air has picked up enough heat to reach a marginally warm temperature, it is exhausted to the outdoors (point C in FIG. 50). Note, however, that this exhaust air is still well below outdoor temperatures, and therefore is capable of some cooling just outside the building.
STEP 4. Calculate heat removed and airflow rate indoors. The heat removed from the building by this air flow depends on two factors: (1) the DB tempera ture difference (?t) between the supply air and the exhaust air (point B to point C in FIG. 50) and (2)
the airflow rate usually expressed in cubic feet per minute:
Btu/h removed = (cfm airflow)
× (1.1 Btu min/ft 3 ºF h)
× (?t, Fº)
The designer can vary the cfm airflow rate by choosing larger or smaller evaporative coolers; any point less than three-fourths of the total distance from outdoor air to saturation may also be chosen.
Some typical evaporative coolers are shown in Section 6.
(e) Cooltowers
One of the first North American cooltowers was shown in FIG. 19, along with estimated cooling design guidelines in FIG. 20. To more closely estimate the performance of such a passive evaporative device with calculations, some very complex equations are involved (for example, see Thompson et al., 1994). For a shorter but less-exact approach, consider this formula proposed by Givoni (1994) in either ºF or ºC:
texit = DB - 0.87 (DB - WB)
where: texit = air entering the space (exiting the cooltower)
DB = dry-bulb temperature, outside WB = coincident wet-bulb temperature, outside This simple equation ignores the potential influences of both wind (driving more air through the evaporative cooling pads) and the optional solar chimney exhaust tower (seen in FIG. 19).
Cooling achieved by the tower depends both on the temperature of this exit air and on its flow rate.
Givoni (1994) proposes, in SI units:
VAH = 0.033 (DB WB) evap -
where:
V = flow, in m3/s (× 1000 = L/s)
Aevap = total area of wetted pads, m^2, in cooltower
H = overall height of tower, m
DB = dry-bulb temperature, outside, C
WB = coincident wet-bulb temperature, outside, C
0.033 = accounts for pressure drop through the tower and the building
Note that this equation ignores the area of both the cooltower and the outlet. Knowing both the temperature and the flow rate, the cooling achieved is W = 1.2V [tint - texit] where W = watts removed from space by cooltower V = flow from cooltower, in m^3/s (× 1000 = L/s) tint = DB temperature to be maintained indoors, C texit = air entering space (exiting cooltower), C In I-P units, this becomes VAH = 2.7 (DB WB) evap -
where:
V = flow, in cfm
Aevap = total area of wetted pads, ft^2, in cooltower
H = overall height of tower, ft
DB = dry-bulb temperature, outside, F
WB = coincident wet-bulb temperature, outside, F
2.7 = accounts for pressure drop throughout the tower and the building
Note that this equation ignores the area of both the cooltower and the outlet. Knowing both the temperature and the flow rate, cooling achieved is Btu/h = 1.1 V [tint - texit] where Btu/h = heat removed from space by cooltower V = flow from cooltower, in cfm tint = DB temperature maintained indoors, F texit = air entering space (exiting cooltower), F In a remote desert west of Tucson, Arizona, the Agua Blanca ranch uses several cooltowers to serve a building around a T-shaped courtyard (FIG. 51). This off-grid building complex uses PV for lighting and water pumping, propane for a refrigerator, and one wall heater and stand-by generator, and collects rainwater in a cistern below the courtyard.
Wood stoves and fireplaces supplement direct solar gain in winter. The courtyard connects to the surrounding ranch by three passages, one covered with a roof and small open skylights, one covered with a deciduous vine on a trellis, and one open to the sky.
Large rolling barn doors are located at the outer end of each passage; these provide both security and the ability to trap cool air from the cooltowers (or via the indoor spaces), thus increasing hot-weather comfort outdoors.
Three cooltowers, 22 ft (6 m) high, each with a total evaporative pad area of 64 ft 2 (5.9 m^2), serve three units around the courtyard. At the outlet of each cooltower, switches allow the flow to be shared, sent to either of two locations, or closed off.
One of the cooltowers can deliver air directly to the covered passage off the courtyard.
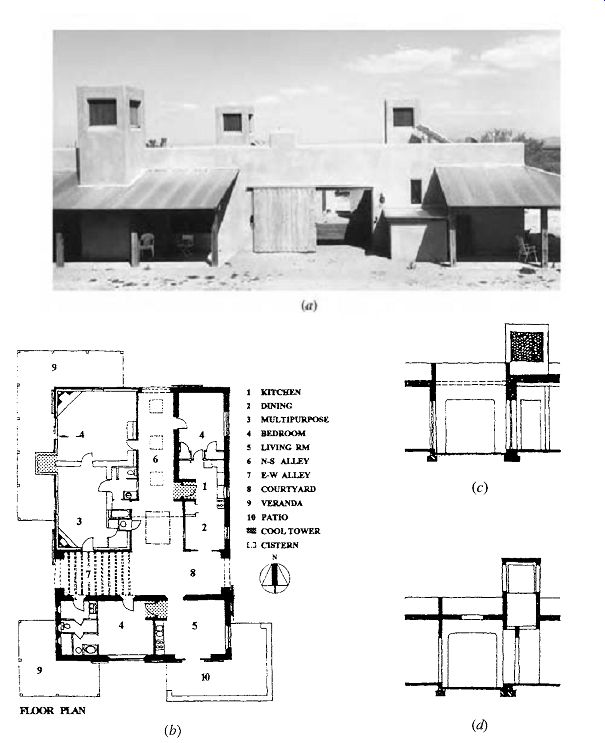
FIG. 51 Cooltowers dominate the silhouette of the Agua Blanca ranch in a
remote desert near Tucson, Arizona. (a) West side, with one of the large rolling
barn doors that allow the courtyard/outdoor spaces to be connected with cooler
breezes or to be protected from hot winds. Air from the cooltowers, after use
within the units, can be discharged to the courtyard, while (under the hottest
conditions) it is still cooler than outdoor air. This helps to form a "cool
pool" of air in the protected courtyard. (b) Plan of three units, each
with a cooltower, around a T-shaped courtyard/covered passage outdoor space.
(c) East-west section through the courtyard. (d) North-south section through
one of the three cooltowers.

TABLE 17 Cooltower Performance Hourly Simulations
Design simulations for a typical June in Tucson predict a flow from each cooltower of about 5000 cfm (2.36 m^3/s), maintaining the indoor temperature at 74ºF (23.3ºC). In these quite small buildings, this translates into an ACH of about 60, considering the volume to include a height up to 6 ft (1.8 m), above which stratification of warm air negates circulation through the upper portion of the space.
These computer-generated design simulations are summarized in TABLE 17. These results differ somewhat from the results of Givoni's (1994) equations, suggesting that perhaps in this case:
texit = DB - 0.70 [DB - WB] and that the flow rate (in SI units) may be closer to VA = 0.04 2 (DB WB) evap z -
where: z = effective height of the tower, that is, from the bottom of the evaporative pads to the top of the outlet to the building.
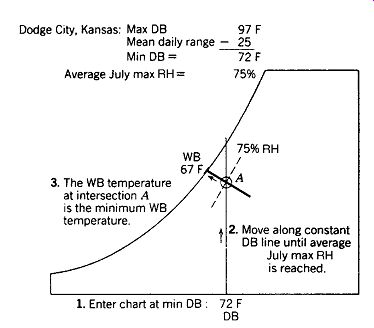
FIG. 52 Finding the minimum (nightly) WB temperature, summer design conditions,
for Dodge City, Kansas.
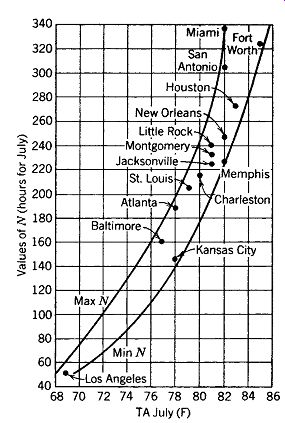
FIG. 53 Range of N, average July operating hours, for residential air conditioners.
(f) Roof Pond Cooling
Before doing the following detailed calculations, be sure to (1) check the summer climate against the passive cooling design strategies (Fig 4.13) to confirm that either the evaporative or the high thermal mass strategy is appropriate, and (2) check the building and climate for approximate performance based upon the design guidelines.
Note, however, that the design guidelines are based only on summer night DB temperature.
With evaporative cooling (such as a light spray onto the surface of the roof pond containers), better performance can be expected, as shown by the following calculation procedure, based on Fleischhacker et al. (1982). This procedure can be used to check the size and depth required for your building's roof pond. It assumes an optimum pond depth of 4 in. (100 mm) but allows for other depths as well.
It appears that a 4-in.- (102-mm)-deep pond with a wet surface of somewhat less than 3000 ft^2 (279 m^2) would be sufficient for this building in this climate.
Once the area and the depth of roof ponds have been determined, questions arise about the architectural integration of such large horizontal surfaces and their relative emphasis on heating or cooling. FIG. 54 shows variations in the treatment of containers and the insulating panels to match the most important thermal role of roof ponds; FIG. 55 shows three typical approaches to the placement of roof ponds on buildings. A valuable source of information about the container bags, sliding insulation, roof decks, and other components needed for roof ponds is the California Passive Solar Handbook by Phillip Niles and Ken Haggard, written for the California Energy Com mission in 1980. Commercially available products include the Skytherm system, developed and pioneered by Harold R. Hay.
A variation of the roof pond (applying primarily to the cooling mode) is to move the water rather than move the insulation. Water-impervious insulation (such as Styrofoam) is secured in place above the metal ceiling at a distance sufficient to be a reservoir for the cooling water. At night, this water is pumped onto the top of the insulation, where it cools by radiation and evaporation, then trickles slowly back into the reservoir. This variation was tested at the School of Engineering Technology, University of Nebraska at Omaha campus.
In winter, the reservoir of water above the metal ceiling acted as thermal mass for a DG passive sys tem. However, cold winter rain must be excluded from that reservoir.
(g) Earth Tubes
The use of the earth as a heat sink, in our culture at any rate, is still in an early development stage. The most direct application would be an underground building with uninsulated concrete walls set against the soil. The problem, of course, is that winter heat loss will likely exceed summer loss; if solar heat can be admitted (e.g., through skylights) to counterbalance the increased winter loss, uninsulated walls sized for the desired summer loss become more attractive.
(However, except in dry climates, condensation on walls may pose a seasonal or even year-round problem.) A more thorough discussion of this option can be found in Watson and Labs (1983).
The long-term potential of the earth as a heat sink is lessened by the fact that soils are relatively slow heat conductors. For example, we ignore winter heat loss through concrete slabs to the earth below, calculating instead the heat losses through the slab's exposed perimeter.
Earth tubes (as discussed under design guide lines in Section 6g) are devices for cooling the incoming ventilating air through earth contact before it enters the building. A small amount of air (perhaps equal to the minimum fresh air requirements-see Tables E.25 and E.26) is usually brought in through several tubes. These tubes are usually 8 to 20 in. in diameter, are buried at a depth of 5 to 10 ft, and are up to 200 ft long.
Table F.12 summarizes several tested summertime applications.
The lowest temperature to which air can be cooled in such tubes will approach ground temperature; the more slowly the air moves through the tube, the more time there will be for cooling. The air temperature might come within 4Fº (about 2Cº) of the soil temperature under good conditions.
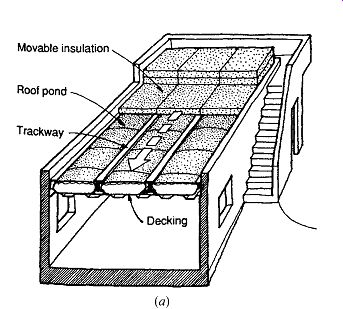
FIG. 54 (a) Key components of roof pond systems with movable insulation.
(b-g) Variations on roof ponds for optimization of heating or cooling performance.
(Niles and Haggard, 1980, California Energy
Commission.)
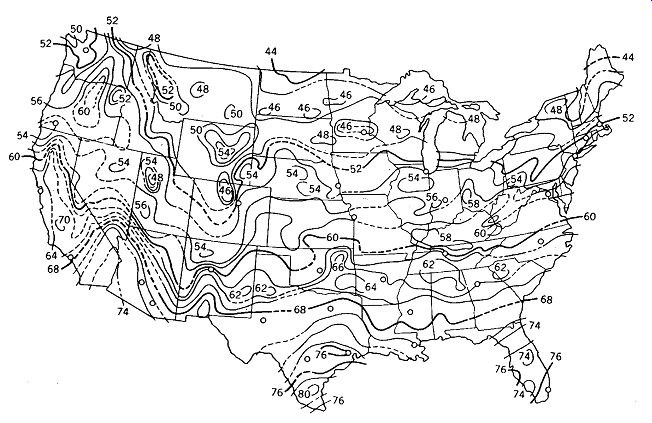
FIG. 56 Distribution of well-water temperature (ºF) in the United States,
adapted from the National Water Well Association. These temperatures may be
assumed to be the yearly average ground temperatures. For seasonal temperature
change amplitude, see Fig. 7.11.

TABLE 18 Roof Pond Design Data
FIG. 55 Three examples of roof pond integration with building form. (a) Insulating panels slide open to stack over exterior (or untempered) space. See FIG. 22 for this system in use. (b) Hinged insulating panels with reflective undersurfaces can act as reflectors to increase winter insolation. However, some interference with summer night sky radiation can result, because the pond surface cannot "see" the entire sky dome. (c) Bifold insulating panels also act as reflectors, interfering less with diffuse solar radiation and allowing somewhat more exposure to the night sky than (b). ( California Energy Commission.)
To approximate soil temperature around the tube:
1. Determine tGW, the groundwater temperature (in ºF) (assumed equal to deep-underground earth temperature) from the map in FIG. 56.
2. Determine tamp, the average amplitude of surface temperature (in Fº), using the map in Fig. 7.11.
3. Determine CF, the amplitude correction factor, depending upon whether the soil outside the earth tube is dry, average, or wet during the cooling period. The amplitudes, or seasonal variations in earth temperature, diminish to near zero at identifiable depths (referred to as CF):
This represents an attempt to simplify a complex problem. The airflow rate is ignored, even though, with very slow flow, there is more time for heat exchange in the tube. The longer the tube is flooded with hot air, the higher will be the earth temperature. For more detailed information about other approaches to earth tubes, see Givoni (1994), C.E. Frances, "Earth Cooling Tubes, Case Studies. . ." in Bowen et al. (1981), Abrams (1986), and Brown et al. (1992).
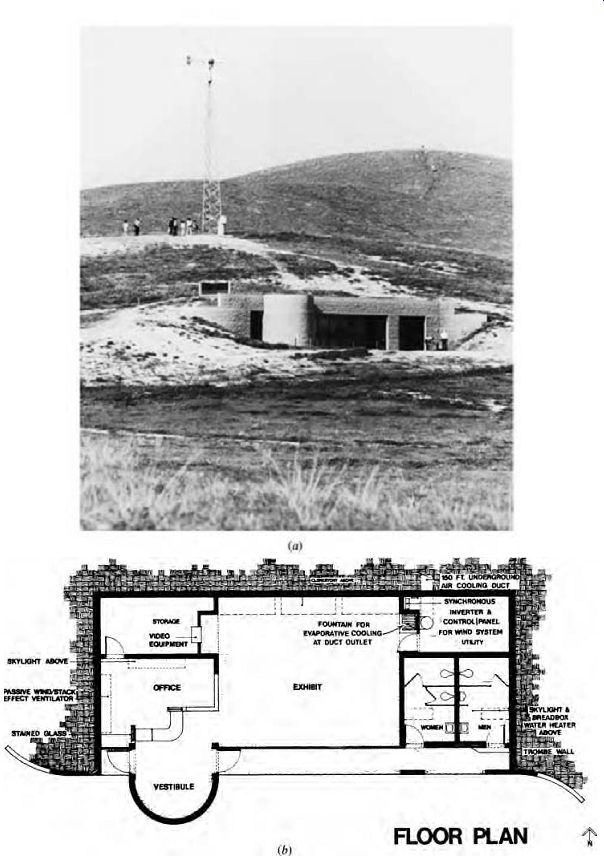
FIG. 57 Visitor Center
for the Antelope Valley California Poppy Reserve near Palmdale, California.
(a) The Visitor Center is set into the field of poppies; an 8-kW wind generator
and the earth tube intake can be seen on the hillside above. (b) Plan shows
earth sheltering for an elongated east-west axis, served both by direct gain
and Trombe wall solar heating and by earth tube/evaporative cooling. (c) Solar
energy enters mostly through the south glass; the glass block skylights and
north clerestory are mostly for even distribution of daylighting. At rest rooms,
a vented Trombe wall is used. Thermal shades on the interior protect the south
glass and north clerestory on winter nights; a roll-down exterior sunscreen
greatly reduces direct solar gain through south glass in summer. Concrete block
walls and concrete roof and floor provide thermal mass, as useful for summer
cooling as for winter solar heating. (d) In summer, the desert air first passes
through an earth tube (assisted by a fan), then is evaporatively cooled within
the building, in sight of visitors. This cooled air picks up the building's
heat and is then exhausted from the stack ventilator.
(h) Passive Cooling Summary
As a summary example of a passively cooled and solar-heated building, consider the Visitor Center for the Antelope Valley California Poppy Reserve, about 85 miles northeast of Los Angeles (FIG. 57). Set in a high desert where winter temperatures sometimes fall below 20ºF, the building is 100% passively solar heated by a combination of direct-gain and Trombe wall strategies, interior thermal shades, and thermally massive ceiling, walls, and floor. An earth sheltered, thermally massive building was chosen for its suitability to the environmentally sensitive site, as well as for its year-round thermal advantage in a desert climate. On summer days when air temperatures frequently exceed 100ºF, a combination of an earth tube and evaporative cooling provides a modest supply of fresh air without overheating.
Continuous power ventilating of the building at night draws the cool outdoor air through the tube, then over the thermally massive surfaces to provide added cooling capacity for the following day. The 2100-ft^2 building also is served by an 8-kW wind generator and has its own well.
15. CASE STUDY-DESIGNING FOR HEATING AND COOLING
Blue Ridge Parkway Destination Center, Asheville, North Carolina
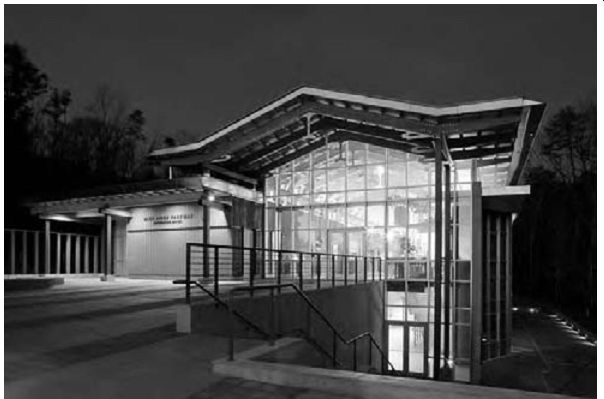
FIG. 59 Blue Ridge Parkway Destination Center near Asheville, North Carolina.
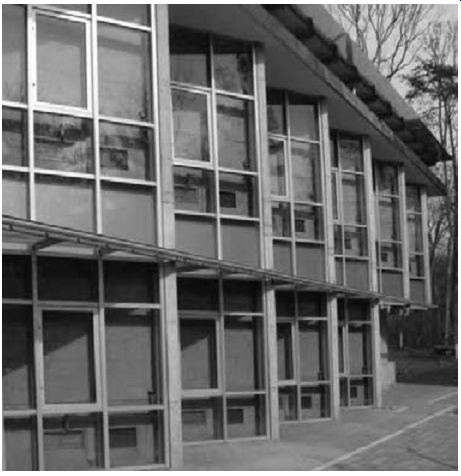
FIG. 61 South-facing, sawtooth Trombe wall with shading to prevent overheating
in the summer.
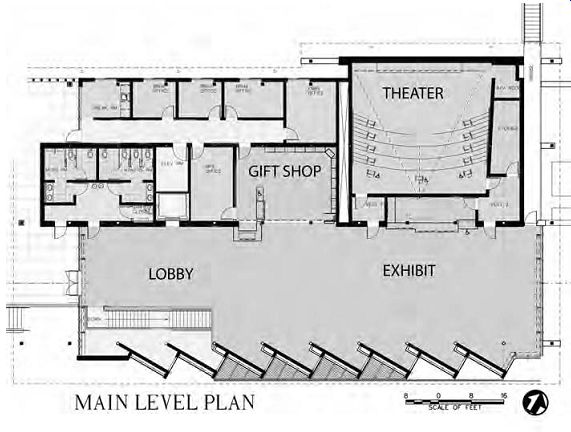
FIG. 60 Main floor plan showing orientation and internal organization.
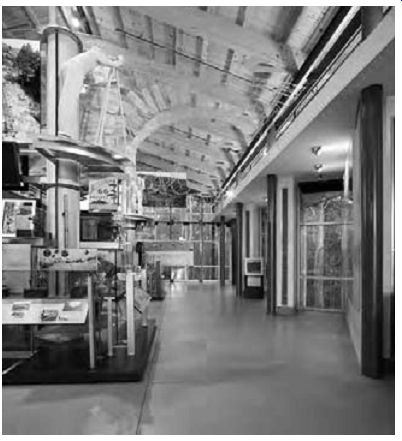
FIG. 62 Exhibit space along the Trombe wall; note supply vents in the edges
of the Trombe wall.
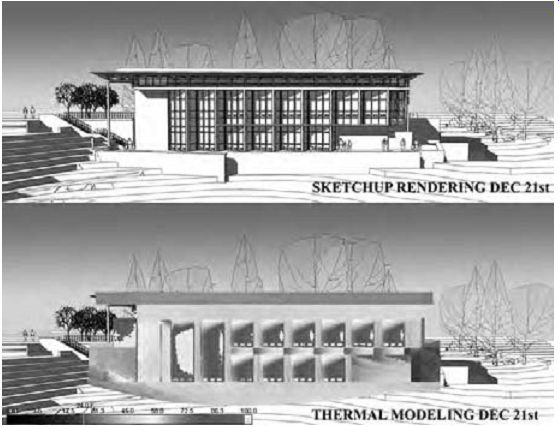
FIG. 63 Images from the shading and thermal performance analyses of the
Trombe wall.
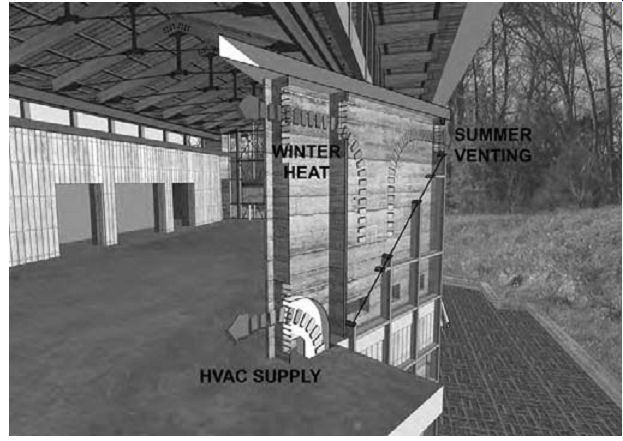
FIG. 64 Diagram showing integrated uses of the Trombe wall as a structural
element along the exhibit space with summer venting, winter heating supply,
and supplemental HVAC supply.
PROJECT BASICS
• Location: Asheville NC, USA
• Latitude: 35.57 N; longitude: 82.57 W; elevation: 2300 ft (652 m) Asheville Airport
• Heating degree days: 4308 base 65ºF (2393 base 18.3ºC); cooling degree days 3365 base 50°F (1869 base 10ºC); annual precipitation: 31 in. (787 mm)
• Building type: New construction; information and orientation services, exhibition spaces, theater, retail shop
• 12,000 ft 2 (1115 m^2) floor area
• Completed: December 2007
• Client: National Park Service (Southeast Region)
• Design team: Lord, Aeck & Sargent, Inc. (and consultants)
Background. The Blue Ridge Parkway Destination Center, located near Asheville, North Carolina, is a new visitor center for the National Park Service located adjacent to the Blue Ridge Parkway head quarters. The Destination Center was developed as a partnership between the National Park Service and the Blue Ridge National Heritage Area to provide information about the Parkway's history and the nearby region between the Shenandoah and Great Smoky Mountains National Parks.
Completed in 2007, the Destination Center is a demonstration of high-performance and eco logical design. Park Superintendent Philip Francis notes that the Destination Center "embraces themes central to the protection, preservation, and thoughtful promotion of the cultural and natural heritages of western North Carolina as well as the entire Blue Ridge Parkway." The Destination Center features a variety of program areas including innovative, interactive exhibits, multimedia information about nearby places to visit, and a 70-seat surround-sound theater that shows a high-definition film about the Park way, its history, and the region's cultural and natural sights and sounds. The design of this green building was a direct response to regional climate conditions, featuring uniquely integrated Trombe walls, a green roof, radiant floors, energy recovery, occupancy sensors, and daylighting.
The design team projects that the building will use 75% less energy than a minimally code compliant building.
Context. Ideal passive solar orientation suggests a building along an east-west axis; however, existing site topography required that the building be oriented 30 degrees west of south to minimize regrading and protect existing vegetation. In the moderate, yet heating-dominated climate of Asheville, the use of passive solar heating offered a clear opportunity to conserve energy. The relatively benign cooling season and low evening temperatures allow for natural ventilation and nighttime ventilation of thermal mass. To optimize the exposure along the southern façade, the designers created a sawtooth-shaped façade, integrating multiple functions of structure, exhibit space, Trombe walls, and ventilation cavities.
Climate analysis and preliminary energy modeling guided the schematic design process.
Design Intent. The Destination Center takes advantage of its geographic location by utilizing the climate for passive solar strategies as well as providing spectacular views of the natural beauty of the Parkway.
In addition to the National Park Service's philosophy of pedagogic environmental interpretive centers, the ecological and energy-efficient building design was guided by the design team's green design philosophy. Some of the key project goals were:
• Achieve Leadership in Energy and Environmental Design (LEED) Gold certification.
• Reduce energy loads through passive strategies (daylighting, passive heating, increased envelope insulation, natural ventilation, green roof).
• Provide additional conditioning through appropriate, efficient HVAC system design (radiant heating, energy recovery).
• Provide a Destination Center that reflects the deep green design philosophy of the design team.
• Complement the natural beauty of the Park way and provide a "tree-house" atmosphere.
• Reduce solar gain in the summer through appropriate orientation and shading.
• Increased adaptive comfort opportunities through passive design strategies.
Design Criteria and Validation. A USGBC LEED Gold certification was awarded to this project. The design team used DOE-2.2 (eQUEST v 3.6) in preliminary analysis to estimate overall energy use. Space heating accounted for 65% of the overall building energy use, and lighting, fans, and space cooling constitute 28% of the remaining loads. Additional energy models run without an HVAC system estimated that the Trombe wall would provide temperatures approximately 8°F (4.4°C) above a standard high-mass building with optimized orientation, and approximately 30°F (17°C) above exterior dry-bulb temperatures. Computational fluid dynamics (CFD) analysis conducted by Pennsylvania State University's Applied Research Laboratory assessed the building in passive mode and showed the benefits of the Trombe walls in the winter-projecting a system effect of a 30°F to 40°F (17°C to 22°C) increase above the outside temperature.
Post-Occupancy Validation Methods. A week long post-occupancy monitoring was performed during the first winter of occupancy to compare the performance of the Trombe walls with the simulations. The architects, along with students from Georgia Tech University, conducted the monitoring.
Performance Data. Information available to date suggests substantial design team success in eco logical design:
• On sunny days the Trombe walls were running 35°F to 40°F (19°C to 22°C) higher than out door temperatures; and 30°F to 35°F (17°C to 19°C) higher at night, correlating well with the preliminary CFD findings.
• Minimum temperatures never fell below the maximum outdoor temperature range, indicating the Trombe wall system is performing well.
At this writing, the building is too recently occupied to provide more in the way of verifiable performance data, although post-occupancy monitoring is ongoing.
FOR FURTHER INFORMATION
Lord, Aeck & Sargeant: Moffit, Debra, "Appalachian Suncatcher," Architecture Week, No. 381. May 21, 2008.
Parkway Destination Center
References and Resources
Abrams, D. W. 1986. Low Energy Cooling. Van Nostrand Reinhold. New York.
Ashley, R. and J. Reynolds. 1994. "Overall and Zonal Energy End Use in an Energy Conscious Office Building," in Solar Energy, Vol. 52, No. 1, pp. 75-83.
ASHRAE. 2007. ANSI/ASHRAE/IESNA Standard 90.1-2007: Energy Standard for Buildings Except Low-Rise Residential Buildings. American Society of Heating, Refrigerating and Air-Conditioning Engineers, Inc. Atlanta, GA.
ASHRAE. 2009. ASHRAE Handbook-Fundamentals.
American Society of Heating, Refrigerating and Air-Conditioning Engineers, Inc. Atlanta, GA.
ASHRAE. 1997. ASHRAE Handbook-Fundamentals.
American Society of Heating, Refrigerating and Air-Conditioning Engineers, Inc. Atlanta, GA.
Balcomb, J. D., D. Barley, R. McFarland, J. Perry, Jr., and W. Wray. 1980. Passive Solar Design Handbook, Vol. 2, Passive Solar Design Analysis. U.S. Department of Energy. Washington, DC.
Balcomb, J. D., R. Jones (ed.), R. McFarland, and W. Wray. 1984. Passive Solar Heating Analysis.
American Society of Heating, Refrigerating and Air-Conditioning Engineers, Inc. Atlanta, GA.
Berry, B., J. Bown, J. Thornton, J. Turzynski, and M. Walton. 1995. "The New Inland Revenue Centre, Nottingham," in The Arup Journal, April. Ove Arup Partnership, London.
Bowen, A., E. Clark, and K. Labs. 1981. Passive Cooling. American Solar Energy Society. Boulder, CO.
Brown, G. Z. and M. DeKay. 2000. Sun, Wind & Light, 2nd ed. John Wiley & Sons. New York.
Brown, G. Z., B. Haglund, J. Loveland, J. Reynolds, and S. Ubbelohde. 1992. InsideOut: Design Procedures for Passive Environmental Technologies, 2nd ed. John Wiley & Sons. New York.
Chandra, S., P. W. Fairey, and M. Houston. 1986.
Cooling with Ventilation. Solar Energy Research Institute. Golden, CO.
Fleischhacker, P., D. Bentley, and G. Clark. 1982. "A Simple Verified Methodology for Thermal Design of Roof Pond Cooled Buildings," in Proceedings of the 7th National Passive Solar Conference. American Solar Energy Society. Boulder, CO.
Gardner, I. and D. Hadden. 1992. " UK Pavilion, Expo '92, Seville," in The Arup Journal, Autumn. Ove Arup Partnership. London.
Givoni, B. 1994. Passive and Low Energy Cooling of Buildings. Van Nostrand Reinhold. New York.
Johnson, T. 1981. Solar Architecture: The Direct Gain Approach. McGraw-Hill. New York.
Mazria, E. 1979. The Passive Solar Energy Book. Rodale Press. Emmaus, PA.
Miller, H. (ed.). 1980. Proceedings of the Passive Cooling Workshop, 5th National Passive Solar Conference. American Solar Energy Society. Boulder, CO.
Niles, P. and K. Haggard. 1980. California Passive Solar Handbook. California Energy Commission. Sacramento, CA.
Olgyay, V. 1963. Design with Climate: Bioclimatic Approach to Architectural Regionalism. Princeton University Press. Princeton, NJ.
SERI. 1981. A New Prosperity: The SERI Solar Conservation Study. Brick House Publishing. Andover, MA.
Stromberg, R.P. and S.O. Woodall. 1977. Passive Solar Buildings: A Compilation of Data and Results, SAND 77-1204, Sandia Labs, Albuquerque, New Mexico.
Thompson, T., N. Chalfoun, and M. Yoklic. 1994.
"Estimating the Performance of Natural Draft Evaporative Coolers," in Energy Conversion Management, Vol. 35, No. 11. Elsevier Science Ltd. London.
U.S. Department of Energy. Building Energy Software Tools Directory
Utzinger, M. and J. H. Wasley. Building Balance Point.
Vital Signs Curriculum Project Resource Module
Watson, D. and K. Labs. 1983. Climatic Design: Energy Efficient Building Principles and Practices. McGraw-Hill. New York. Wittwer, V., W. Platzer, and M. Rommell. 1991.
"Transparent Insulation," Solar Today, January-February.
Yoklic, M. and M. Layseca. 1998. "Earth Construction, Courtyards, Verandahs, and Cooltowers: An Arizona Ranch House with Middle East Vernacular," in Proceedings of the 23rd National Passive Solar Conference. American Solar Energy Society. Boulder, CO.
Prev. | Next
Home Similar
articles top
of page