AMAZON multi-meters discounts AMAZON oscilloscope discounts
This section presents a complete set of reports for control of a large and complex maintenance organization. Those involved in smaller and simpler operations may thus select the reports that fit their own specific situation. Larger organizations commonly use computer complexes to record, store, calculate, and print the reports. Smaller organizations generally must accomplish all this manually.
Specific recommendations for smaller organizations are provided where it is believed this is necessary and valuable.
Control reports must provide sufficient and correct information. Decisions must be made before rather than after the fact. The old method of running a maintenance department by the seat of the pants and simply recording cost after the fact is fast disappearing.
The control of maintenance must include the proper balance of:
1. Preventive and corrective maintenance-including the predictive-maintenance technique
2. Routine repair work
3. Spares
4. Work on downtime
5. Work during production
6. Alteration and construction (minor)
7. Safety, environmental
8. Others
The proper balance of these items may well be the key to survival of a company. Maintenance must be controlled (1) on a short-range basis by the job; (2) on an annual basis to balance major projects work and provide for orderly vacations; and (3) on a long-range basis (over 1 to 10 years or more) to assure proper skills, space, and equipment as needed.
The maintenance function is not a separate entity. It is not pure overhead. It is just as important as any other function. The prime relationship is to production, and the reports identified here emphasize that fact. The relationship to stores, accounting, engineering, and other functions will be properly identified by reports.
The following reports will be detailed in this section:
1. Average PS number--how important is the known work?
a. By craft
b. By production department
2. Backlog-how much work is there?
a. Available to work
b. Total
3. Schedule compliance-is the most important work being done first?
4. Labor efficiency
5. Materials costs
6. Percent downtime
a. By department and in total
b. Total
7. Maintenance costs as a percent of sales dollar
The most important aspect of any maintenance-control function is a priority system that gives proper recognition to every piece of equipment in the plant. It must (1) consider plant utilities and their transmission lines, (2) consider the various aspects of safety and environmental work, and (3) be simple enough for all to understand, rigid enough not to be abused, yet flexible to cover changing conditions. The priority system (PS) illustrated below properly handles these basics. Its most important asset is that it is a priority system assigned by both production and maintenance.
====
Priority System for Planning and Scheduling of All Maintenance Work ("The PS Number")
Production Assigned
PRODUCTION NO. DESCRIPTION
10. Equipment which will shut down the entire
9 plant if not operating. All safety work orders
8. Equipment that will shut down an entire
7 department if not operating
6. Equipment that will reduce the output of the 5 department if not running. Equipment that r will shut down an entire department if not s running when installed spares are available N for immediate operation
4. Auxiliary equipment that is important to the 3 operation of a department but will not shut s down the department or cause a major loss u in production if not operating
2. Convenience items, cost-saving equipment, buildings, roads, etc.
Maintenance Assigned
SERVICE NO. DESCRIPTION
9. Breakdowns. Safety hazards where loss of life or limb is probable
7. Preventive maintenance production assistance.
Maintenance work performed during production runs to keep equipment running or to improve quality
5. Repairs to major parts or units that are not running. Work requiring the scheduled shutdown of a department or major system.
Normal health and safety work
3. Shop work or other routine work. Repairs to spare parts or units not installed when several units are available for immediate production runs
1. Painting for appearance or protection. The use of skilled crafts for cleanup other than their work areas
========

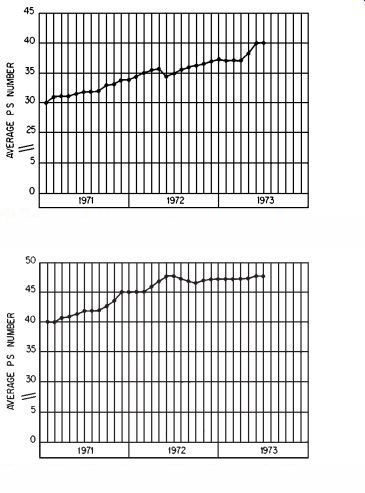
FIGURE 1 Weighted average PS number (electrical).
FIGURE 2 Weighted average PS number (by production department).
To set up the PS system, identify every piece of equipment in the plant with a production assigned (even) number. Publish this list to all concerned, and make sure they thoroughly understand the concept. The production number should then be identified on every work order. In the case of dual-purpose equipment or debatable numbers consider the profitability of the product and production schedules in assigning the production number. Production numbers can be changed several times a year to handle seasonal work or drastic changes in schedules.
The maintenance department will assign the service number as it receives the work order and will then multiply the two numbers to achieve a priority number for each work order. The lowest priority is thus the number 2 and the highest priority number is 90. The work orders with the highest priority numbers should be scheduled first. A portion of the maintenance hours available, ranging generally from 10 to 30 percent, should be assigned to priority work lower than 30. This properly considers potential failure costs and keeps low-priority equipment and departments operating.
The "control" aspect of the PS system is twofold. The average PS number by craft identifies how important the backlog is for each craft and for maintenance in total. The average PS number by production department (and/or plant in the case of multiple plants) provides knowledge of the average level of maintenance.
Calculate a PS number/man-hours weighted average involved for each craft and each production department. For instance, compare two jobs. One has a PS number of 90 and requires 3 man-hours of work by an electrician. Another has a PS number of 30 and requires 1 man-hour of work by an electrician. The weighted average is:
90 PS _ 3 man-hours _ 270 30 PS _ 1 man-hour _ 30 300/4 hr _ 75 average
Minimal use of the system will quickly identify acceptable control limits for many things.
Examples might be:
1. Authorize overtime for a work order with a PS number of 42 and higher.
2. Subcontract or add manpower in a craft with an average PS of 56 or higher for more than 4 weeks and a constant trend up.
3. Transfer assigned manpower from lower-priority departments to higher-priority departments until the average PS in the department reaches 42 or lower.
A monthly plot on 5-year graph paper of the average PS number by craft and production department will show trends, potential trouble, eventual needed manpower, and the average level of maintenance work. These are illustrated in Figs. 1 and 2.
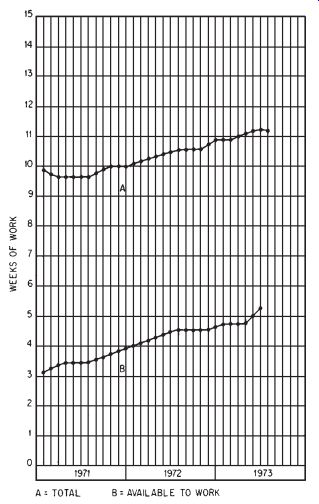
The available manpower-to-work backlog and the total backlog calculations are also essential in controlling manpower on a short- and long-range basis. If no work is available, employees will fear a layoff and will slow down in spite of all management can do. If there is a lot of work, they will recognize this and perform. Figures plotted by craft for the amount of work compared with the importance of the work (average PS) provide total knowledge of the labor portion of maintenance work.
This is illustrated in Fig. 3.

FIGURE 3 Backlog of work (electricians).

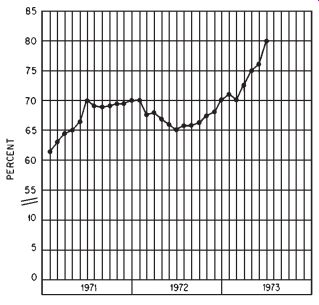
FIGURE 4 Percent schedule compliance.
"Backlog" is commonly expressed in weeks of work. Total scheduled hours per week are calculated for all the members in a craft less a percentage for absenteeism and vacations generally ranging from 10 to 30 percent. These deductions result in a total available man-hour figure.
Total available man-hours divided into the hours of work available to calculate available weeks of work available for the craft with downtime, prints, and materials ready. Available backlog should generally range from 2 weeks to 6 to 10 weeks. The backlog available should not exceed the weeks of spares available.
The total backlog considers all known work. Prints, materials, downtime, and other factors may prevent the work from being completed, but the total weeks of backlog should be plotted. Excessive total backlog (over 10 or 15 weeks) may be cause for project postponement, subcontracting, adding manpower, and overtime as the requirements are met.
Knowledge of the amount of available backlog and its importance (average PS) is rather meaningless without control of the work actually scheduled and accomplished. This control is exercised through a schedule-compliance report (Fig. 4). The highest-priority work in the available backlog should be scheduled daily and/or weekly. In larger organizations a daily schedule is prepared by computer for each craft. In smaller organizations a weekly schedule is prepared manually by craft or in total.
The actual man-hours worked on scheduled jobs is divided into the total scheduled man-hours by craft (or department) to arrive at a schedule compliance percentage. Schedule compliance should range from 70 to 95 percent in well-run organizations. In larger organizations where there are full time planners and schedulers, line supervision should not be permitted to deviate from schedules except for severe emergencies. The allowable percentages calculated for emergencies as previously itemized should still permit 85 to 95 percent schedule compliance.
Materials costs are controlled by planners and engineers predetermining what materials and spares should be used before the work is begun. In many organizations the accounting function classifies subcontracted work as materials costs. This practice has a bearing on ratios and relationships listed below. Janitorial work is handled as maintenance labor by accounting in many organizations and will also influence ratios.
In most cases large spare units (as much as $7500), assemblies, or even individual parts are capitalized. These spares are vital and necessary and expensive but are not included in any ratios discussed in this section.
Maintenance material costs by craft and by production unit and/or production department should be recorded on 5-year graph paper. These graphs are indicators of the success of preventive maintenance, planning and scheduling, and supervision.
The percent of maintenance downtime of the total scheduled hours is a vital report for top management. This percent is used in determining the number of production hours to schedule individual pieces of equipment, departments, and plants. The percent is useful interdepartmentally to gage the effectiveness of PM programs for individual craftsmen, craft departments, and the department in total.
Acceptable percentages of maintenance downtime range from a low of 0 in continuous chemical operations to a high of 10 to 20 percent. Obviously, if no downtime is permitted, there must be a wealth of in-line connected spares. For example, in chemical operations it is quite simple (but expensive) to have two or three pumps connected and operational. Only opening and closing of valves is required to put them in use.
Accepted downtime percentages range from 3 to 8 percent for most industries, and a commonly used indicator of maintenance costs is as a percentage of the sales dollar. As sales volumes increase, maintenance costs, as a percentage of sales dollars, should decrease. There is also a minimum maintenance cost regardless of production volume.
Top management usually translates maintenance costs into a budgetary figure. Sophisticated operations with good managers will then itemize the budget for each craft and/or department.
Manpower and material will then be controlled within the budget based on predicted sales and shipments.
The economist viewpoint usually dictates monthly budgets for maintenance. In other words, don't spend money for maintenance unless production volume justifies the expenditure. This is fine from an accounting-economist or top-management viewpoint, but the maintenance administration of a monthly budget rigidly held is another matter.
Good production runs provide maintenance budget dollars but no downtime for repairs or installation of spares. It is possible to spend the budget money available for parts and spares and stockpile them for future use. The loss here is on interest, and, of course, space availability is a major consideration.
In low-volume periods there may be plenty of downtime but no money even for labor-the maintenance manager's dilemma. The obvious answer is good sales projections and annual budgets, plus the necessary reports to give top management the information it needs.
PREV | NEXT | Article Index | HOME