AMAZON multi-meters discounts AMAZON oscilloscope discounts
(cont. from part 1)
7. SOUND AND AIRFLOW
Sound and airflow are considered together here because they are so difficult to separate. Many buildings that could be opened to ventilation or cooling by breezes rely instead on forced ventilation because of noise that would accompany breezes through an open window. Pollution is another potential deter rent to natural ventilation. Almost any object or device that reduces noise will also reduce the velocity of a breeze, as is true of most filtering devices used to remove dust particles.
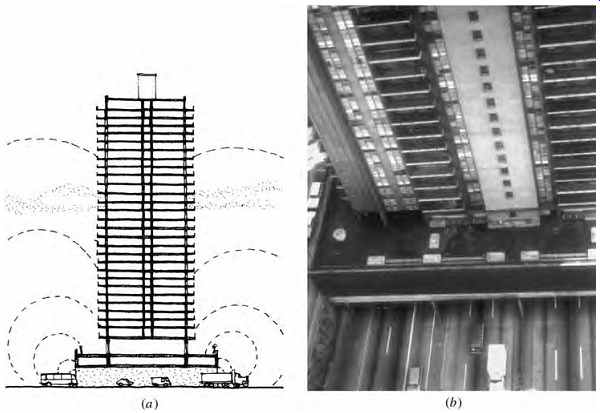
FIG. 20 Apartment buildings in series straddle the approach ramps to New
York City's George Washington Bridge. (a) Section along the freeway. (b) Looking
down to the freeway. These buildings were the scene of a study linking noise
levels with reading disabilities for occupants of the apartments.
(a) Noise
Any sound that is unwanted becomes noise. The urban building in FIG. 20 is unusual both in pro viding an opportunity for wind-driven ventilation-air moves freely below it as well as around it-and in the extraordinary intensity of traffic noise that is borne on the air.
Two characteristics of cities contribute to increased noise at street level: hard surfaces that reflect rather than absorb sound and parallel walls that intensify sound by inter-reflection rather than dissipating it. Increasing horizontal and vertical distances from urban noise sources affect outdoor noise levels in various ways, as shown in the graphs of FIG. 21. Unfortunately, obtaining much distance between sound source and receiver in dense urban areas is quite difficult.
Although building surfaces are generally made of hard materials for durability in weathering, softer and multiplaned materials (such as plants) are desirable from a public noise-reduction viewpoint. Their impact on measured sound levels may be slight, but visually softer surfaces reinforce a perception of acoustically softer environments (much as the sound of running water reinforces our perception of cool environments). Fountains are especially useful sources of masking sound; they can be kept flowing as long as a noise persists, and they enhance the cooling function of natural ventilation via evaporative cooling, especially in drier climates.
Not all spaces benefit from masking sound; where a single sound source is expected to predominate over all others, masking sound will interfere and become unwanted "masking noise." Where site conditions allow, barriers to street noise can be installed that cast sound shadows on a site (FIG. 22). Such barriers may do little to reduce noise levels at upper windows, but surface activities can be given much lower noise levels, especially near the barrier. Many cities now require such barriers between new housing developments and high ways or railroads.
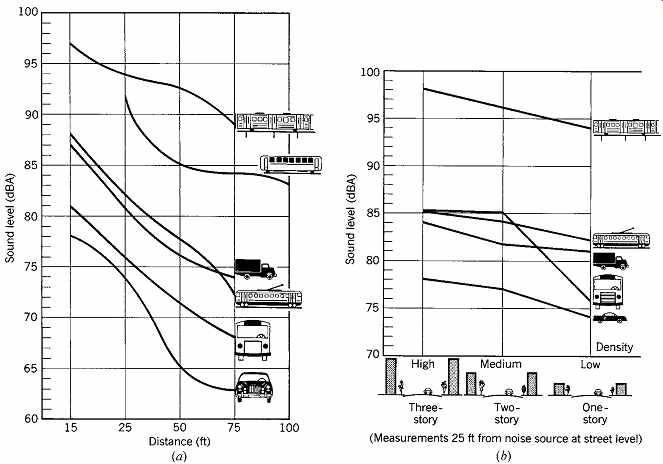
FIG. 21 Predicting noise levels outdoors. (a) Distance as a factor influencing
sound pressure level. (b) Building height as a factor in noise propagation.
(From Clifford R. Bragdon. 1971. Noise Pollution: The Unquiet Crisis. University
of Pennsylvania Press.)
Another urban noise source is the mechanical equipment of buildings themselves. Many noise complaints against buildings involve air conditioning equipment (the compressive refrigeration cycle and its year-round utilization as a heat pump are described in Section 9). When densely packed buildings are forced to rely upon mechanical cooling, such closeness makes the noise of the systems even more annoying. Noise is generated both by the compressor and by the great quantities of outdoor air that must be rapidly pushed through outdoor condenser coils. The condenser's need for outdoor air is so critical that attempts to surround it with noise shields can hinder its efficient operation and shorten its life. Fortunately, more recent permission.) energy-efficient equipment is quieter, although not silent.
In residential neighborhoods, the greater distance between buildings might be expected to lessen these difficulties. Yet the much lower ambient (or background) sound level of residential areas is one of their more appealing characteristics, and an intruding compressor on a hot summer night can irritate neighbors who formerly enjoyed cool-and quiet-night breezes.
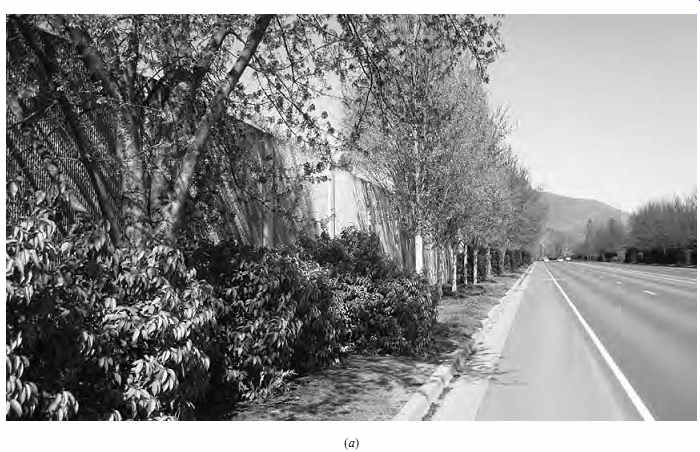
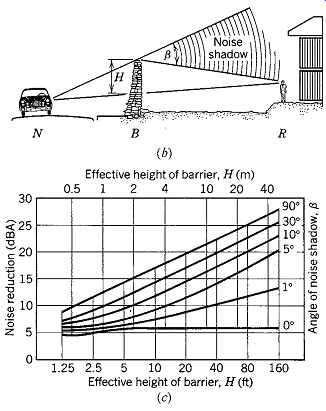
FIG. 22 Outdoor noise barriers. (a) A noise barrier abutting a highway in
central Oregon. (Photo by Nathan Majeski.) (b) To determine the approximate
noise reduction (in decibels) due to an outdoor barrier, construct a section
locating the noise source (N), the solid barrier (B), and the receiver's location
(R). On this section, determine the effective height (H) of the barrier and
the diffraction angle (ß) with the resulting "noise shadow." Enter
graph (c) with H and ß; where the lines intersect determines the noise reduction
in dBA (left axis). A reduction of 10 dBA is perceived as half as loud as the
original source. Note the perceptible noise reduction from simply breaking
the line of sight (ß = 1°). (From Doelle, 1972. Reprinted by permission.) For
a more detailed procedure, see Fig. 19.33.
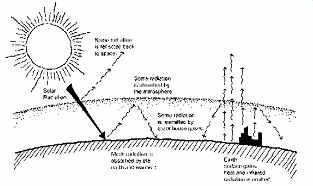
FIG. 23 The greenhouse effect traps heat in the Earth's upper atmosphere.
Clouds and particles in the atmosphere reflect about one-fourth of incoming
solar radiation while blocking about two-thirds of the heat that the Earth
would otherwise lose to outer space. Currently, the atmosphere keeps the Earth
about 33ºC (60ºF) warmer than it would be without this heat-trapping process.
Increases in greenhouse gases theoretically will reflect more incoming solar
radiation but block even more outgoing radiation, resulting in global warming.
(Drawing by Amanda Clegg.)
Table 3 Air Pollution: Sources and Effects
(b) Air Pollution
Problems of global importance are resulting from air pollution; these are summarized in Table 3.
Building construction and operation are among the contributors to air pollution. The greenhouse effect (FIG. 23) threatens to produce global warming, a trend most scientists now firmly believe is under way. The greenhouse effect occurs because gases that block the outgoing flow of long-wave radiation (heat) from the Earth's surface are accumulating in the atmosphere. Energy production and use (especially of fossil fuels) are contributing heavily to these greenhouse gases, which include carbon dioxide, methane, nitrous oxide, ozone, and chlorofluorocarbons (CFCs). Another serious threat is stratospheric ozone depletion, with potentially devastating consequences to ecosystems due to increased ultraviolet radiation received at the Earth's surface.
The designers of buildings can influence these trends in several ways. First, they can help to greatly reduce the air pollution caused by electric power plants and by burning fuel in buildings, by designing for greater energy conservation and by utilizing clean and renewable energy sources within buildings. Section 8 is concerned largely with this topic. Second, they can specify materials and equipment that, through their manufacture or operation, lessen air pollution. This suggests avoiding fuel combustion (coal, oil, trash, wood, and natural gas, roughly in descending order of air pollution threat). This philosophy also encourages selection of refrigeration equipment that uses environmentally friendly refrigerants, as well as insulation and upholstery products made with non-CFC blowing agents. Many of these practices are mandated, but the designer can go further and seek out the most environmentally benign products.
Buildings are substantial contributors to air pollution: the fuel combustion within, the power plants that supply electricity, the incinerators and landfills that receive waste from buildings. Buildings and power plants are major contributors to the greenhouse effect and the primary causes of acid rain (sulfur oxides) and smog (nitrogen oxides). The transportation that takes people to and from buildings is another major air pollution source.
We design buildings to utilize "fresh" air, whether by natural or forced ventilation; we must then also design buildings to preserve our fresh air resource. The less energy buildings require, the cleaner the outdoor air will be.
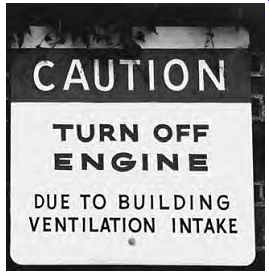
FIG. 24 Reactive protection of an outdoor air intake. A loading dock near
an intake was a source of indoor air pollution from truck motor fumes, prompting
the installation of a warning sign.
On site, local sources of air pollution must be minimized and, as far as possible, isolated.
Combustion gases pose a threat, especially where vehicles approach buildings (FIG. 24). Idling truck motors at loading docks or automobile motors at drive-up service windows can threaten building occupants through openings such as doors and windows; mechanical system fresh air intakes are particularly vulnerable, because outdoor air is intentionally drawn into them. Again, consider the neighboring buildings: will the location of some activity on your site threaten a neighbor's fresh air?
(c) Wind Control
For most buildings, wind (like sun) changes from resource to detriment with the change of seasons.
In many locations, wind also changes its prevailing direction with the seasons. Control of wind often means utilizing wind-sheltered areas in winter while encouraging increased wind speeds in summer.
From spring through fall, outdoor spaces might benefit from this barrier-to-connector changeover on a daily basis: less wind during cool mornings, more during hot afternoons. Fortunately, winds are generally weakest in the early mornings and strongest in the afternoons because of the effect of the sun's heating on the surrounding environment.
The generalized patterns of wind flow around thin windbreaks and thicker buildings (FIG. 25) help us to understand where shelter and increased airflows occur. These patterns, however, are much more complicated than they first appear and are highly influenced by objects upstream, to the sides, and downstream of the wind-directing object being analyzed. Wind-tunnel tests using scale models are far more reliable than these generalized patterns; unfortunately, such tests are expensive and still fraught with opportunities for mis-prediction. Nevertheless, a site can and should be analyzed graphically for seasonal wind utilization.
Wind ultimately returns to its original flow pattern after encountering an obstacle such as a windbreak or a building. Before it reaches the obstacle, it slows, builds (positive) pressure, and turns upward or sideways. As it passes the obstacle, it increases its speed, and reduced (negative) pres sure results at the sides of and behind the obstacle.
These pressure differences, flow patterns, and the size and shape of the wind-protected areas behind an obstacle are all usable for control of air motion, both inside a building and outside.
Windbreaks are commonly used to protect outdoor areas; these can be fences or plants.
Figure 26 shows the relative reduction in wind velocity at the level of a windbreak as wind approaches and then passes. The distances (horizontal axis) are in units of the height of the windbreak.
Note that the densest windbreak produces the greatest reduction in wind speed behind it-but that the wind recovers its full velocity closer to such a barrier, compared to a less-dense windbreak. Thus, the more dense the windbreak, the greater the reduction in wind speed but the smaller the area so affected.
Gaps in windbreaks can produce increased wind speeds through the gaps. Figure 27 shows a small area of wind speeds above a windbreak even greater than the undiverted wind speed. Although a gap is a threat to winter wind protection, it is an opportunity for summer wind speed enhancement.
Given constant prevailing summer wind directions, a windbreak gap could provide a small area with above-average air motion.
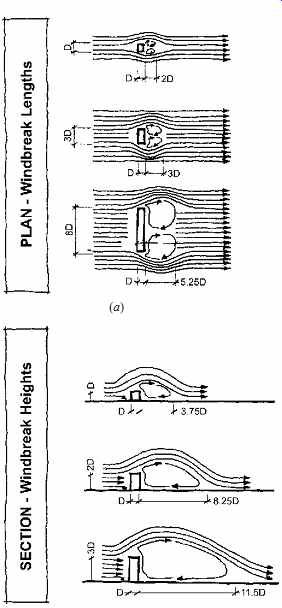
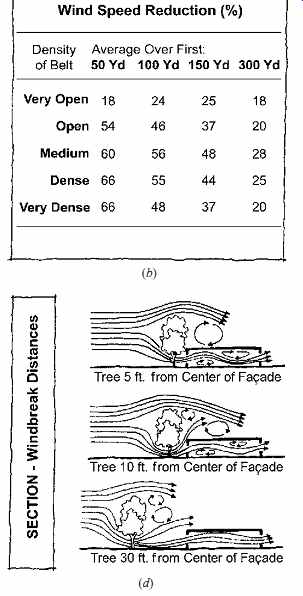
FIG. 25 Approximate patterns of wind around objects. (a) Effects of different
barrier lengths (widths). (b) Reduction in wind speed due to windbreak density.
(c) Effects of different barrier heights. (d) Wind flow through trees and buildings.
(Reproduced with the permission of the American Institute of Architects; ©
1981, AIA. Redrawn by Jonathan Meendering.)
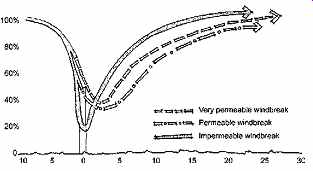
FIG. 26 Wind speed reduction behind windbreaks of varying permeability.
Solid (impermeable) barriers produce the lowest wind speeds, but these are
effective for the shortest distance beyond the windbreak. Units of distance
= heights of windbreak. (Brown and Gillespie, 1995. Redrawn by Erik Winter.)
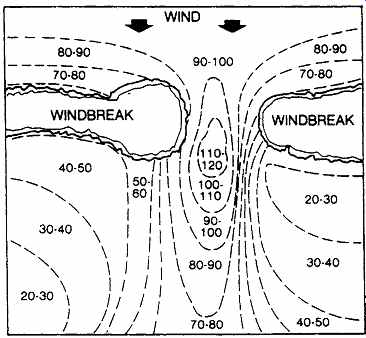
FIG. 27 Wind speeds accelerate through a gap in a windbreak. Numbers indicate
the percentage of the incoming (unaffected) wind speed. (From Caborn, J. M.
1957. Shelterbelts and Microclimate. Edinburgh: H.M. Stationery Office. Cited
in McPherson, 1984.)
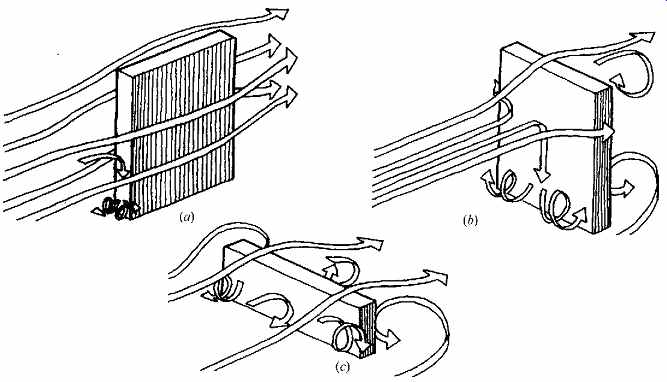
FIG. 28 Wind patterns around single buildings. (a) Tall, slender buildings:
height greater than 2.5 times the width. (b) Tall, rather wide buildings; height
between 2.5 and 0.6 times the width. (c) Long buildings; height less than 0.6
times the width. (From Beranek, W. J.. "General Rules of the Determination
of Wind Environment," in Wind Engineering, J. E. Cermak [ed.], Vol. 1;
© 1980, Pergamon Press Ltd. Reprinted by permission.)
Wind flow around buildings is a complex matter; nevertheless, some general patterns for shelter areas are shown in FIG. 25, whereas Figs. 28 and 29 show wind behavior to be expected in typical building combinations. Some patterns from the situations shown in FIG. 29 include:
• With the bar effect (a), the downward-spinning wind behind a building can reach 1.4 times the speed of the average wind.
• With the Venturi effect (b) and few obstructions upwind or downwind from the narrow neck of a building, wind speeds through the neck can reach 1.3 times the average, up to heights of 100 ft (30 m), and 1.6 times the average at about 165 ft (50 m) in height.
• The gap effect (c) begins to occur with perpendicular winds and buildings of more than 5 stories (50 ft [15 m]) in height; by 7 stories, wind speeds 1.2 times the average can occur through the gaps; by 60 stories, gap wind speeds can be 1.5 times the average.
• For higher buildings (d), increased wind speeds occur at the corners (localized within a radius from the corner equal to the width of the building "d"); where height is 50 ft (15 m), wind speed can reach 1.2 times the average; for heights above 115 ft (35 m), wind speed can be 1.5 times the average. Where two towers approach each other, increased wind around corners and between the towers can go as high as 2.2 times the average for towers 330 ft (100 m) high.
• Increased wind speed and turbulence within the wake of buildings (e) can be especially serious for towers at heights from 16 to 30 stories, where wind speeds can reach 1.4 to 2.2 times the average.
Beranek (1980) discussed methods for charting the shelter areas in such building groups.
Localized effects of wind turbulence between buildings can have a particularly powerful impact on entryways. People leaving the controlled air motion of a building lobby are often unprepared for the speed and turbulence of channeled wind just beyond the doorway.
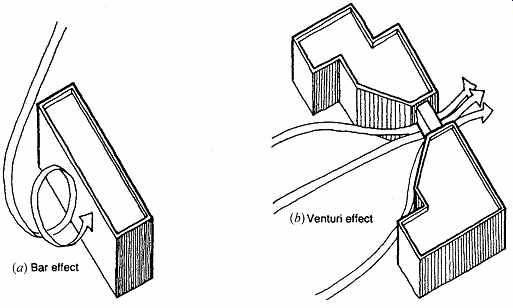
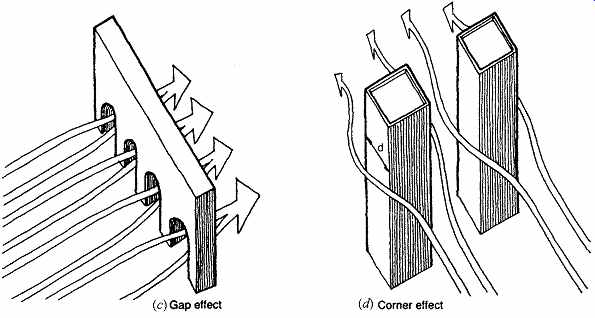
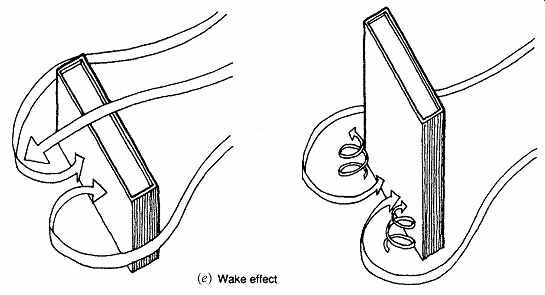
FIG. 29 Wind patterns among building clusters (see text for quantification).
(From Gandemer, J. "Wind Environments Around Buildings: Aerodynamic Concepts," in
Wind Effects on Buildings and Structures, K. J. Eaton [ed.]; © 1977, Cambridge
University Press. Reprinted by permission.)
Wind flow for the cooling of buildings is discussed in detail in Section 8.
(d) Ventilation and Cooling
Outdoor air is introduced to buildings for two distinct reasons. Ventilation involves the provision of fresh air to interiors to replenish the oxygen used by people and to help carry away their by-products of carbon dioxide (CO2) and body odors. Ventilation is desirable year-round; recommended minimum rates of fresh airflow are found thru Google. Passive cooling (with outdoor air) replaces heated indoor air with cooler outdoor air. Cooling by breezes is a seasonal opportunity, limited to times when the outdoor air temperature is lower than the indoor air temperature, and the outdoor humidity is at or below that desired indoors. When outdoor air temperatures are about the same as interior temperatures, breezes might still be useful to increase interior air motion, thus extending the comfort zone, as quantified by Olgyay (1963) and discussed in Section 4.
Although airflows for indoor air quality control and for cooling are both commonly referred to as "ventilation," they are not identical design situations. Building codes/standards typically rigidly define ventilation. Airflow for passive cooling can require far greater quantities of air than air flow for control of air quality, and the influence of such requirements on building siting and window size and placement is considerable. Figure 30 illustrates the differing approaches to these two uses for airflow and suggests that window position and human occupants be considered together in design.
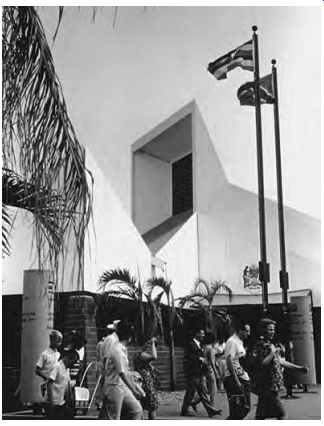
FIG. 31 Cooling with the wind. The air inside this exhibition hall is heated
by lights and crowds of people. It rises via the stack effect and is sucked
out of the large clerestory opening by the prevailing winds. Note that winds
do not blow into this high opening but create a negative pressure outside the
opening, encouraging an outward flow of air from the exhibition space. ( African
Place at Expo '67, Montreal, Canada; John Andrews, architect.)
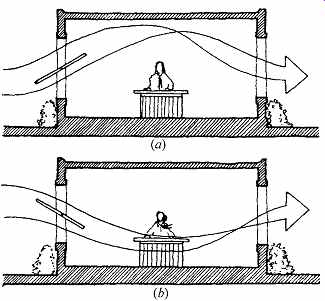
FIG. 30 Ventilation with and without occupant cooling. The size and position
of a window will influence the flow of air within a space. (a) Ventilation:
the window directs breezes upward, removing hot air at the ceiling. Airflow
has minimum contact with occupants. (b) Space ventilation and people cooling:
the window directs breezes toward the floor and across occupants and pro vides
a direct people-cooling effect from air motion and fresh air for the space.
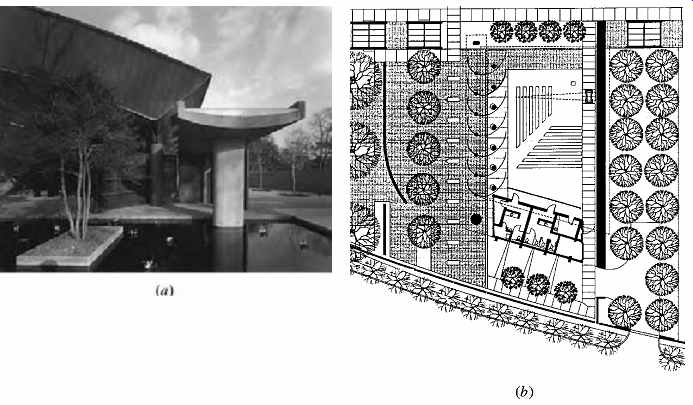
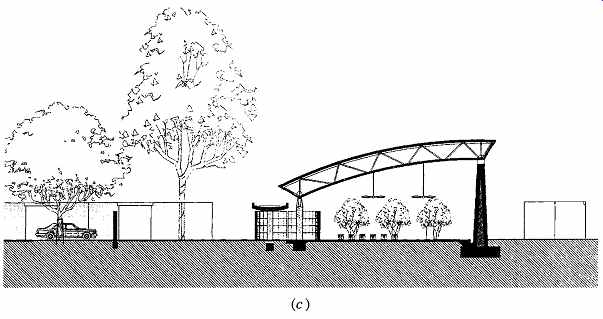
FIG. 32 The Beth Israel Chapel and Memorial Garden, Houston, Texas. (a)
View from the west. The oversized gutter delivers rainwater to a pond that
reflects daylight. Trees on islands in the pond provide evening shade. (b)
Plan. Curved walls visually separate the open south courtyard from the roofed
chapel but allow breezes to pass. A narrow triangular roof opening allows a
shaft of direct sunlight to fall along the interior north wall, marking the
passing of time. (c) Section, south to north. The curved roof sheds rainwater
to an oversized gutter above the curved walls. Suspended ceiling fans can augment
air motion. (Photo by Timothy Hursley. Courtesy of Solomon Inc., Architecture
and Urban Design, San Francisco.)
Two examples of contemporary buildings that use the wind appear in Figs. 31 and 32. The first served as a summer exhibition space in Montreal, Canada, and relied upon prevailing winds (and on rising hot air) to remove air heated by display lighting and crowds of people. The second is a chapel in a cemetery in the hot, humid climate of Houston, Texas. The architects intended this shaded, open-air space as a respite from the sealed, air conditioned buildings and cars prevalent in Houston. In this building, a funeral is a time and place for reunion with physical phenomena; breezes and shade trees provide cooling, rainwater collected in a pool reflects skylight, and a narrow shaft of direct sun marks its daily path along the rough stone interior north wall.
Table 4 Beaufort Scale (Lower Speeds Only)
A building that relies on prevailing wind for cooling must be sited with attention to wind direction. One building should not be erected to obstruct another building's access to breeze. As seen previously, obstacles upstream from intake openings or downstream near an outlet can substantially reduce the velocity-and thereby the cooling effect-of the wind. Wind can cool people in hot weather (primarily by increasing evaporation from the skin), yet it can become an irritant at higher speeds (Tables 4 and 4). Manual controls for openings are a necessary part of a natural ventilation design. Finally, the proper size and placement of openings, with an unobstructed airflow path through the building, must be provided.
(e) Wind, Daylight, and Sun
When daylight and wind-driven ventilation are desired, their design constraints combine to limit building width. Multistory hotels are an example; where such hotels fill entire blocks, they are often arranged around a central atrium, and the surrounding building is only two hotel rooms and one corridor deep. Multistory office buildings used to have a similar form, but increasing urban density and reliance on electric lighting and mechanical cooling have changed their form considerably (FIG. 33). There is now a trend back to arranging office workspaces closer to daylight openings and, in Europe, to including operable windows for fresh air as well.
When wind and sun are combined, they tend to be influential in opposite seasons. Fresh air, how ever, is desirable year-round, so in winter a sup ply of tempered fresh air is necessary. Figure 34 captures some issues surrounding a design decision regarding whether to face a clerestory to the north or south for a given set of seasonal prevailing winds.
8. RAIN AND GROUNDWATER
Most buildings interact with four forms of water: rainwater and groundwater involve lightly con trolled exterior interactions, whereas potable water and wastewater involve tightly controlled interior services.
Rain, like solar energy, is a generally diffuse, intermittent, and often seasonal resource. It is most often collected on site and used as a source of water where other water resources are scarce or of poor quality. Rain, like sun, has an influence on building design: heavy rains and pitched roofs have long been found in the same locales. Overhangs may extend farther beyond walls exposed to storm winds; gutter and downspout details can become a design feature, as shown in the chapel in FIG. 32 and in several other examples in the book. A building that reflects the combined influences of day light, wind, and rain is shown in FIG. 35.
Rainwater's impact on site design can be thought of as similar to that of wind. Once on the surface, it will flow downhill in a wide path (on a wide plane), and buildings that obstruct this path must make provisions to divert it. Slight, shallow ditches called swales are frequently used in such diversion. The orientation of a building to the slope can also affect surface water diversion, as shown in FIG. 36.
FIG. 33 In contrast to office building plan (a), which uses daylight and
natural ventilation in each office, office building plan (b) receives cooled,
filtered air, is less subject to exterior noise, typically provides both constant
light and temperature throughout, and provides for more rentable floor space
on its site. It also allows less daylight to reach the street level, requires
much more electricity (though probably less heating fuel), and thus contributes
more heat (and possibly more noise from mechanical equipment) to its surroundings
year-round.
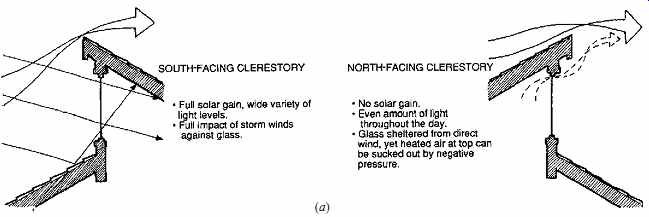
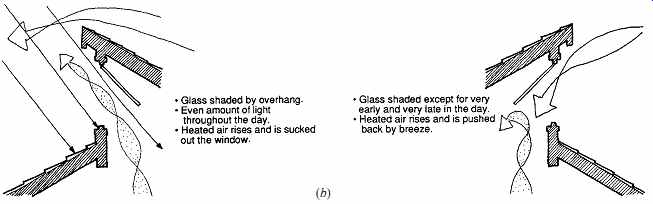
FIG. 34 Some relative advantages of north versus south orientation for a
clerestory window/shed roof combination. (a) Winter, with low sun and southerly
storm winds. (b) Summer, with high sun and northerly breezes. (These wind directions
are prevalent in the Pacific Northwest.)
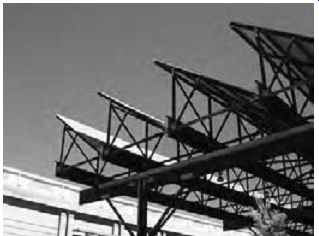
FIG. 35 This roof over a covered outdoor tennis facility at the University
of Oregon, Eugene, was designed to ward off rain-bearing south winds in winter.
Direct glare from the sun is also unwelcome; instead, north skylight is admitted
along with reflected light from roof surfaces. Gutters at the lower edge of
each roof plane carry away rainwater; the courts stay dry for all but a few
days each year. (Unthank Seder Poticha Architects. Photo by Amanda Clegg.)
Surface water can be used to advantage in thermal, acoustic, and daylighting roles. Hot, dry breezes that pass over water surfaces (and especially through misty sprays above ponds) gain substantial moisture while undergoing a drop in dry-bulb temperature, as a result of the evaporative cooling process. Such conditioned air can provide improved comfort in hot, dry conditions. If a water feature also provides the sound of running water, it can serve to mask noises such as traffic or conversations in adjacent rooms.
Surface water plays a more complex role in daylighting due to the reflection characteristics of water. The surface of water is highly reflective to light striking at low angles of incidence; for example, the reflections of the setting sun from the small pond will illuminate the ceiling and east wall of the chapel in FIG. 32. On the coast, reflected sunlight from an infinitely huge surface can throw a blinding sheet of light across buildings on the shore. Conversely, sunlight near noon in summer strikes a water body at high angles of incidence--nearly perpendicular at southern U.S. latitudes. Water is highly absorptive and transmissive to radiation at these angles, thereby reflecting relatively little light. Therefore, water bodies east, south, and west of buildings can provide increased reflected light on sunny winter days and somewhat decreased reflected light in summer, relative to alternative grass surfaces. On heavily overcast days, however, when the sky is uniformly gray (and the least amount, but most glare-free quality, of daylight is available), water surfaces will not be particularly helpful.
The reflection of sunlight off water tends to be in sparkling patches of always-changing patterns.
This can provide a fascinating design feature or it can be annoying (either as glare or as a distraction from a visual task). Reflected off a matte-finish ceiling, such dancing light might be welcome; reflected directly into eyes or onto a work surface, it easily becomes a problem. Sparkle for one viewer may be glare for another.
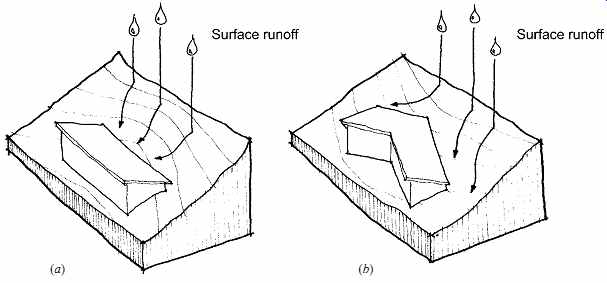
FIG. 36 Rain as surface flow. (a) Where buildings intercept surface water,
provisions for diversion are necessary. A building sited as in (b) needs less
elaborate provisions, as the form itself is a diverter. (Drawing by Dain Carlson.)
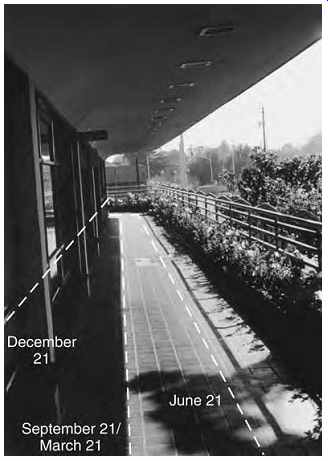
FIG. 37 Fixed overhang sun control. This south-facing exterior corridor
in Oregon is open to the air year-round. Low winter sun fills the corridor,
and some of its heat is stored by the tile floor. In cold weather, however,
the offices connected by the corridor are disadvantaged by unbuffered exposure
to cold air. In summer, little of the corridor is exposed to sun, improving
comfort. Sun control is identical in the (cool) spring and (warm) fall with
such fixed shading.
Groundwater is generally avoided by designers where possible, as it is a threat to foundations and below-ground spaces. This avoidance carries over into site planning; marshy places are usually unwelcome near buildings and represent an eco logically sensitive area as well. In urban areas, dry soil conditions are intensified as ponds are drained, streams are piped away, and hard surfaces impede water percolation into the soil.
Groundwater has interesting thermal potential as a heat sink, providing a place to discharge building heat in summer and providing heat from groundwater for winter building heating. The quantity of groundwater available to act as a heat sink varies with geographic location and subsurface conditions, and little information is readily avail able to indicate its potential on a given site. Geothermal systems using groundwater are becoming very common. As more buildings discharge heat to and tap heat from this resource, eventually ground water temperatures will change, but by how many degrees and for how long remains unpredictable.
Groundwater pollution is another risk, through increased handling of groundwater or from refrigerants in the mechanical cooling equipment. As a result of such concerns, many localities now strictly regulate the use of groundwater as a heat sink/ source.
The ready ability of water to conduct and store heat, which encourages its use as a heat sink, also makes it a thermal nemesis for heat storage tanks and bins in solar-heated buildings. There is little point in storing heat from solar energy in an underground tank for later use if surrounding groundwater is allowed to strip the tank of its heat.
Groundwater, however, can help storage tanks for cooling systems. Such tanks are often used to provide cooling water to buildings during peak load hours on hot days and can greatly lessen the demand for electricity to run conventional air conditioners.
Snow has special site design implications: it delays runoff, provides a blanket of thermal insulation, absorbs sound, and reflects more solar radiation than almost any other naturally occur ring surface. Wind patterns can deposit snow much more thickly in some places, for better or worse. Snow hampers the movement of external control devices such as awnings or thermal shutters, can collect to excess on external light shelves, and can create disabling glare if it reflects low winter sun into windows at eye level.
9. PLANTS
Plants play several roles on a building site: They affect the absorptivity and emissivity of the Earth's surface; they are part of both the food and water cycles; by day they turn carbon dioxide into oxy gen; they can provide organic matter suitable for building materials; and they help people mark time both by growth and by change with the seasons.
Our associations with plants are mostly pleasant ones, and they contribute to the enjoyment of the places where they grow.
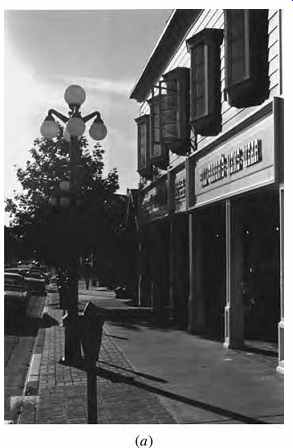
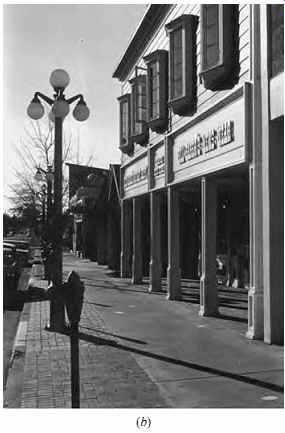

FIG. 38 A deciduous tree as a naturally "smart" shading device.
In hot August, the tree is in full, dense leaf, providing shade. In cold January,
bare branches admit winter sun. These photographs were taken on the equinox
at 4:45 P.M. solar time: (a) On September 21, the local average temperature
is 75ºF (24ºC) and the tree functions as a shading device. (b) On March 21,
the local average temperature is 53ºF (12ºC) and the tree has fortuitously
not yet developed its leaves. (From Reynolds, 1976.)
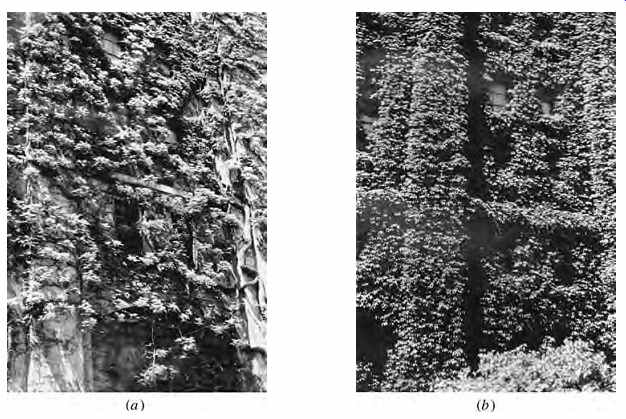
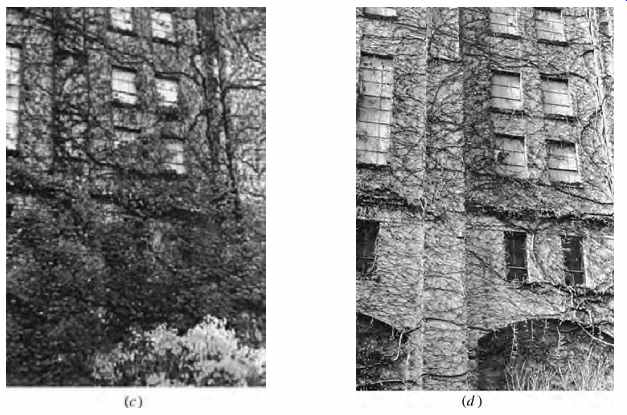
FIG. 39 Deciduous vines, temperature, and sun position. The sun's path through
the sky is identical in late May (a) and late July (b). Paired-but lower-sun
paths occur in late November (c) and late January (d). This deciduous vine
responds more to the temperature of its Oregon climate than to the sun's position,
which makes it particularly useful as a sun control device. (For termite control
and wall longevity, it is best to keep vines on a trellis rather than on the
wall surface.) (From Reynolds, 1976.)
Table 5 Deciduous Trees for Summer Shading and Winter Solar Collection
Plants are also of immediate practical value to building design because they enhance privacy, slow the winter wind, reduce glare from strong day light, and/or prevent summer sun from entering and overheating buildings. In the last role, plants are particularly noteworthy, because they enhance a feeling of coolness when breezes rustle or sway their leaves. Most importantly, they respond more to cycles of outdoor temperature than to the cycles of sun position. Unlike fixed-position sunscreens on buildings, plants thus provide their deepest shade in the hottest weather.
To illustrate this mechanical-horticultural contrast, a fixed sunscreen (an overhang for south facing windows) is shown in FIG. 37. Such sun screens block the sun for some defined portion of the year, centered on June 21; that is, maximum shade is provided at the summer solstice. A typical approach to such sunscreens in the U.S. temper ate zone is to shade at least half of a south window in a residence (or all of a window in an office with internal heat loads) from March 21 to September 21 (vernal equinox to autumnal equinox). Yet, March is (on the average) a colder month than September; March 21 is the last day of winter, whereas September 21 is the last day of summer.
Indeed, average monthly temperatures for June and September can be quite similar. Full solar radiation is more welcome in early spring than in early fall, yet sun position is identical at these times. In contrast to fixed sunscreens, deciduous plants do most of their shading from the middle of June to early October, giving windows access to solar radiation throughout much of the spring (Figs. 38 and 39).
Deciduous trees have a potential disadvantage for solar heating, in that certain species (such as sweet gum and some oaks) hold on to their leaves well into the heating season, a tendency increased by fertilizing or irrigating near a tree. Other trees have a dense branch structure, blocking a surprisingly high percentage of solar radiation even when bare (Table 5). Agricultural extension services in most areas can provide information on the hardiness and average dates of defoliation for various tree species. For solar collection, avoiding trees or large shrubs within the area shown in FIG. 40 is recommended. In this protected zone, a deciduous vine on a trellis above a south-facing window is a better planting strategy.
Many large buildings have a relatively short heating season because they have constant internal heat gains. For such internal-load (heat-dominated) buildings, a tree or vine that foliates early in spring, defoliates late in fall, and has low transmissivity in summer is advantageous. The choice of trees, shrubs, and vines to improve a site and/or building microclimate can best be made after a month-by-month analysis of building heating and cooling needs.
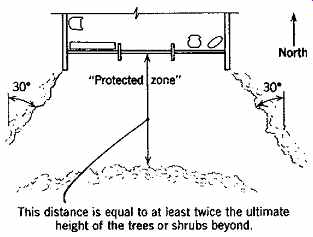
FIG. 40 Protecting access to winter sun, given a lawn or terrace of limited
size to the south of solar collecting surfaces. Coniferous and even deciduous
plants within the "protected zone" should be avoided unless they
are very low growing or are a reliably early defoliating species (see Table 5). Summer sun protection for such south-facing windows is best provided
by flexible architectural controls such as awnings or hanging screens.
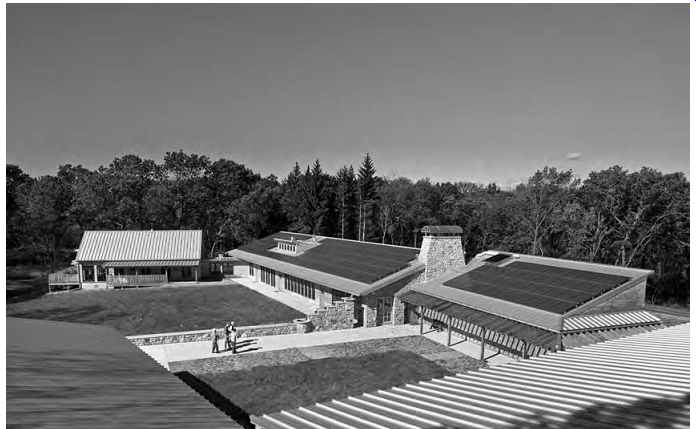
FIG. 41 The Aldo Leopold Legacy Center in Baraboo, Wisconsin (north of Madison),
which attained LEED Platinum certification. (© The Kubala Washatko Architects,
Inc.; used with permission.)
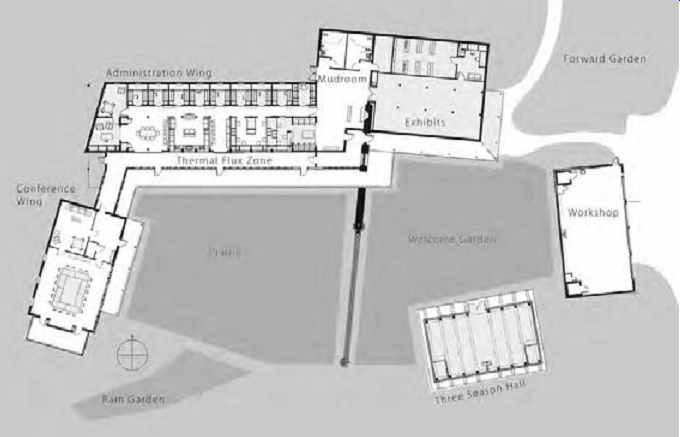
FIG. 42 Site plan of the Aldo Leopold Legacy Center showing elongated buildings
and southern orientation around a courtyard. (© The Kubala Washatko Architects,
Inc.; used with permission.)
10. CASE STUDY-SITE AND RESOURCE DESIGN
Aldo Leopold Legacy Center, Baraboo, Wisconsin
PROJECT BASICS
• Location: Baraboo, Wisconsin
• Latitude: 43.52 N; longitude: 89.46 W; elevation: 974 ft (297 m)
• Heating degree days: 7673 base 65ºF (4263 base 18.3ºC); cooling degree days: 2389 base 50ºF (1327 base 10ºC) at Madison airport; annual precipitation 33.8 in. (858 mm)
• Building type: New construction; offices, meeting rooms, exhibit area
• 13,000 ft 2 (1208 m2) [8644 ft 2 (803 m2) conditioned space]
• Completed Spring 2007
• Client: Aldo Leopold Foundation
• Design team: The Kubala Washatko Architects, Inc. and consultants
Background. The Aldo Leopold Legacy Center is a Leadership in Energy and Environmental Design (LEED) Platinum certified project, the first ever earning 61 of 69 possible points and the first to earn a point for being a net-zero carbon-neutral building. Site and resource design were integral components in achieving this aggressive goal, which will be discussed in the following sections to demonstrate the opportunities and resources that are on-site, free, and ready to be captured. The Aldo Leopold Foundation's (ALF) mission is to uphold the land ethic, and this unwavering goal helped to motivate the design team to exemplify the founding principles of the Foundation through innovation and sustainability. The Aldo Leopold Legacy Center utilizes a number of passive strategies and is constructed with local materials not traveling more than an average of 100 miles per pound (359 km per kg).
Context. The Aldo Leopold Legacy Center (ALLC) is an organization dedicated to promoting Aldo Leopold's land ethic. Leopold, author of the Sand County Almanac, developed a land ethic and belief that the term "community" should expand to include elements such as the "soils, waters, plants and animals, or collectively: the land." His writing set the stage for the modern conservation movement in terms of our current ecological thinking. The original building, called the "Leopold shack" served as a retreat as well as a center for ecological research. Formerly a chicken coop, the shack was built primarily of found materials, used passive strategies for daylighting and ventilation, and required no electricity. Design of the new center retained the same ethic of conservation present in the shack, even with increased occupancy, energy demands, and building functions.
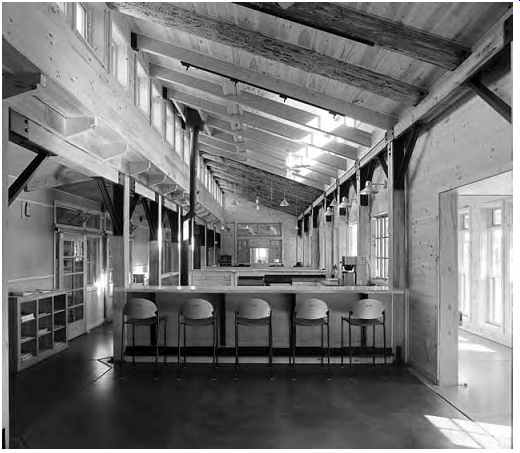
FIG. 43 Administrative center of the Aldo Leopold Legacy Center, with clerestories
and daylight zoning throughout the building- strategies that helped to reduce
the use of electric lighting. (© The Kubala Washatko Architects, Inc.; used
with permission.)
Design Intent. The ALLC is a direct reflection of Aldo Leopold's values. The leading principles (intent) behind the design included:
• Respect Aldo Leopold's land ethic in all aspects of design.
• All occupied zones are perimeter zones designed for daylight and natural ventilation.
• Minimize electric lighting use during occupancy.
• Minimize HVAC systems use during occupancy.
• Minimize motive power in all piping and ductwork systems.
• Achieve a building energy demand goal of 17,000 kBtu per square foot of floor area per year (0.46 kWh per m2 per year).
• Generate energy on site from solar radiation and biomass.
• Achieve carbon-neutral building operation.
• Utilize on-site wood resources in the building.
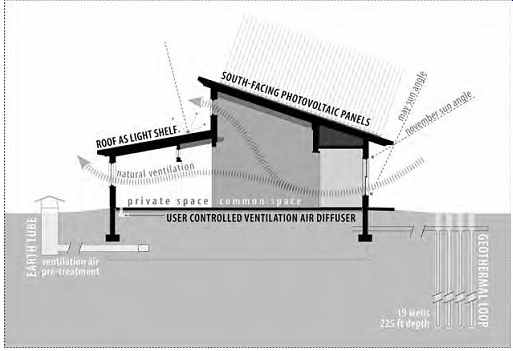
FIG. 44 Building section showing strategies for lighting, heating, cooling,
and ventilation. (© The Kubala Washatko Architects, Inc.; used with permission.)
The Center was built on land that was previously used for housing; hence no new land was built upon. Ninety-thousand board feet (27,400 board-meters) of wood harvested from nearby forests, including many red and white pines planted by Aldo Leopold himself in the 1930s, were used in the building. The smaller trees were kept "in the round," which allowed the sapwood, the strongest part of the wood, to remain intact.
Each selectively harvested tree from the site was measured and its use accounted for within the building. Natural ventilation, daylighting, and passive solar strategies helped the center reach the carbon-neutral benchmark, although active systems are needed to meet the occupants' comfort needs during very cold and hot and humid conditions. Energy sources for the building include on-site photovoltaics, solar hot water panels, and wood-burning heat. Radiant floors meet heating and cooling loads in the offices and exhibit space.
Required ventilation air is tempered by earth tubes.
Additional energy, if needed, is purchased from wind power providers. On a net annual basis, the ALLC is designed to produce 110% of the energy that is required for its operation.
Design Criteria and Validation. The project achieved a LEED Platinum rating, with the highest number of LEED points earned to date in the certification process. The project also earned a point in the Innovation and Design category for achieving car bon neutrality in building operation. To develop an appropriate energy use goal for the building, the design team researched energy consumption and production of other buildings of similar size and function, and also calculated the amount of solar radiation available to the site to find the potential for solar energy use. The team took a unique design approach by first establishing a solar budget by using the available roof area of 3000 ft 2 (278.7 m2) for a photovoltaic array that would provide 50,000 kWh per year of energy. The design team then set a maxi mum building energy demand to fall within the solar budget: approximately 8600 ft 2 (799 m2) of conditioned building area resulting in 5.7 kWh per square foot (0.46 kWh per square meter) per year.
Post-Occupancy Validation Methods. Energy modeling using the TRNSYS software integrated with the CONTAM program was performed during the preliminary design phases. Performance monitoring over a 12-month period is currently being per formed by Michael Utzinger of the University of Wisconsin-Milwaukee.
The design model suggested that the building would generate approximately 3100 Btu per square foot per year (35,216 kJ/m2) more energy from on-site renewable energy than the building would require for operation. In its first year of operation, the building has required approximately 4300 Btu per square foot per year (48,848 kJ/m2) more than the renewable energy generation. A colder than normal winter, record annual snowfall (covering the PV array in January and February), and some system operation errors are assumed to cause the performance shortfall. The building operations are currently being modified for the second year of occupancy.
Performance Data. Information available to date suggests that the design team succeeded in upholding the Leopold legacy by utilizing on-site energy and resources:
• The building achieved a LEED Platinum rating.
• Total emissions: 45.3 metric tons of CO2/yr.
• Offset from renewable energies: -20.8 metric tons of CO2/yr.
• Forest sequestration: -29.1 metric tons of CO2/yr.
• Net result: -4.6 metric tons of CO2/yr.
• Half of all wood used in the building, 90,000 board feet (27,400 board-meters), was harvested on site and milled 70 miles (112 km) away.
• The building materials on average only traveled 100 miles per pound (359 km per kg) to the site.
• More than 95% of construction waste was recycled.
• The project is designed to meet the goals of the 2030 Challenge.
• The building uses 70% less energy than a typical building its size.
• The building was named an AIA COTE Top Ten Building for 2008.
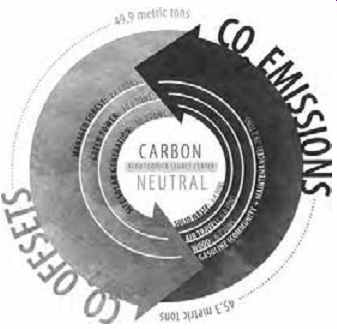
FIG. 45 The carbon emissions diagram showing carbon neutrality: a balance
of emissions versus offsets. (© The Kubala Washatko Architects, Inc.)
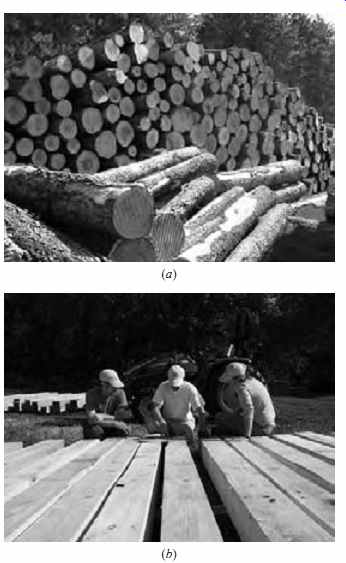
FIG. 46 (a) Trees selectively harvested from the site. (b) Accounting for
each tree and placement of each board within the building. (© The Kubala Washatko
Architects, Inc.)
FOR FURTHER INFORMATION
The Aldo Leopold Foundation: http://www.aldoleopold.org/
Boehland, Jessica. "Building on Aldo Leopold's Legacy." Green Source, April 2008. pp. 80-85.
The Kubala Washatko Architects, Inc.
Chapa, Jorge. 2007. " First LEED Platinum Carbon Neutral Building!" Inhabitat
Wisconsin Green Building Alliance
References and Resources
ASES. 1981. Passive Cooling. American Solar Energy Society. Boulder, CO.
Beranek, W. J. 1980. "General Rules for the Determination of Wind Environment," in Wind Engineering, J. E. Cermak (ed.). Pergamon Press. Elmsford, NY.
Bragdon, C. 1971. Noise Pollution: The Unquiet Crisis. University of Pennsylvania Press. Philadelphia.
Brown, R. D. and T. J. Gillespie. 1995. Microclimatic Landscape Design: Creating Thermal Comfort and Energy Efficiency. John Wiley & Sons. New York.
Cohen, S., D. C. Glass, and J. E. Singer. 1973. "Apartment Noise, Auditory Discrimination, and Reading Ability in Children," in Journal of Experimental Social Psychology, Vol. 9.
DeKay, M. 1992. "A Comparative Review of Daylight Planning Tools and a Rule-of-Thumb for Street Width to Building Height Ratio," in Proceedings of the 17th National Passive Solar Conference, Cocoa Beach, FL. American Solar Energy Society. Boulder, CO.
Doelle, L. 1972. Environmental Acoustics. McGraw Hill. New York.
Gandemer, J. 1977. "Wind Environment Around Buildings: Aerodynamic Concepts," in Wind Effects on Buildings and Structures, K. J. Eaton (ed.). Cambridge University Press. New York.
Graedel, T. E. and P. J. Crutzen. 1989. "The Changing Atmosphere," in Scientific American, September.
Harden, G. 1968. "The Tragedy of the Commons," in Science, Vol. 162, Issue 3859, 13 December.
Knowles, R. 1981. Sun, Rhythm, Form. MIT Press. Cambridge, MA.
Landsberg, H. E. 1970. "Climates and Urban Planning," in Urban Climates. World Meteorological Organization Technical Note 108. Geneva.
Lawrence Berkeley National Laboratory, Heat Island Group
Lowry, W. P. 1988. Atmospheric Ecology for Designers and Planners. Van Nostrand Reinhold. New York.
Lowry, W. P. and P. P. Lowry. 1995. Fundamentals of Biometeorology, Volume 2: The Biological Environment. Peavine Publications. McMinnville, OR.
Marsh, W. M. 1991. Landscape Planning, Environmental Applications, 2nd ed. John Wiley & Sons. New York.
Mazria, E. and D. Winitsky. 1976. Solar Guide and Calculator. Center for Environmental Research, University of Oregon. Eugene.
McPherson, E.G. (ed.). 1984. Energy-Conserving Site Design. American Society of Landscape Architects. Washington, DC.
Montgomery, D. 1987. "Landscaping as a Passive Solar Strategy," in Passive Solar Journal, Vol. 4, No. 1. American Solar Energy Society. Boulder, CO.
Olgyay, V. 1963. Design with Climate: Bioclimatic Approach to Architectural Regionalism. Princeton University Press. Princeton, NJ.
Reynolds, J. S. 1976. Solar Energy for Pacific Northwest Buildings. Center for Environmental Research, University of Oregon. Eugene.
U.S. Environmental Protection Agency, Global Warming Site
Ozone Depletion Resources:
http://www.epa.gov/docs/ozone/
Watson, D. and K. Labs. 1983. Climatic Design. McGraw-Hill. New York.
Prev. | Next
Home Similar
articles top
of page