AMAZON multi-meters discounts AMAZON oscilloscope discounts
SITE ANALYSIS TYPICALLY PRECEDES SITE planning. The purpose of a site analysis is to under stand the character of a given site. Such an analysis usually includes the collection of information on utility availability, noise sources, zoning, views, solar access, traffic and pedestrian patterns, climate, and the like. In some cases, long-term statistical data are available as an information resource (such as for climate, solar position, utility services); for other variables (such as noise, views, pedestrian circulation in an urban area) there is usually no existing database, and all information must be collected directly by the designer. To be useful and successful, a site analysis must do more than simply catalog information; it must place value on the collected information in the context of a proposed project and its design intent. For a given building, is solar radiation a desirable resource or a problem to be solved? Is wind a usable design element or an environmental force to be avoided? Understanding what resources are available for inclusion in a design solution, and what natural forces are potential problems to be mitigated by design, is the essence of site analysis-and a necessary precursor to green design.
A designer's early site-planning decisions will, at a later date, influence available options for a building's climate control and lighting systems and affect a building's overall consumption of energy.
When the site is seen as a collection of resources (sun, wind, water, plants) and also as part of the environment we all share, buildings can greatly reduce dependence upon nonrenewable fuels. They can also do this without limiting the availability of local energy resources for neighboring buildings.
In addition to saving energy, the use of on-site resources can create outdoor spaces that become especially pleasant to be in. Such spaces can direct winter sun to a glass wall while blocking the wind, or funnel summer breezes through shade to an open window. Site planning is greatly influenced by economic considerations, zoning regulations, and adjacent developments, all of which can interfere with the design of a site to utilize the sun, the sky, and the wind. Integration of all these concerns at the site-planning stage is the first step in adapting a building to its climate. This section looks briefly at some aspects of site-climate interactions.
1. CLIMATES
Climate is a long-term statistically derived picture of weather. Weather is what happened today or yesterday, while climate is what happened over the past 10, 15, or 20 years. Our most familiar names for climates describe their most severe season, as shown in FIG. 1. This is a convenient means of description, but it can be misleading for designers. "Cold" climates can have very hot, some times humid summer days; hot-arid climates can have bitterly cold winter conditions. Before designing buildings that will modify exterior conditions to provide indoor comfort, we should know when and how much modifying is appropriate. This is not necessarily easy, as there are 8760 hours in a year and several climatic variables of interest for each hour (temperature, relative humidity, solar radiation, wind speed, etc.). A graphical means of portraying all these variables is helpful. A very useful set of graphic analysis tools for climates was developed by Olgyay (1963) under the name bioclimatic design. Bioclimatic design links comfort and climate. Section 4 provides details on thermal comfort, but a discussion here of Olgyay's approach will provide an introduction to a few key issues.
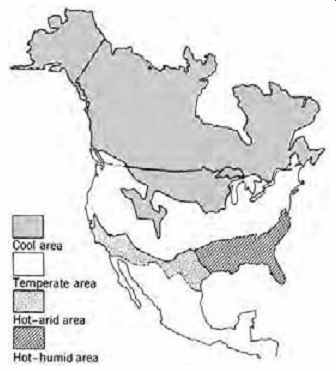
FIG. 1 Regional climate zones of the North American continent. (From Victor
Olgyay, Design with Climate: Bioclimatic Approach to Architectural Regionalism;
© 1963 by Princeton University Press. )
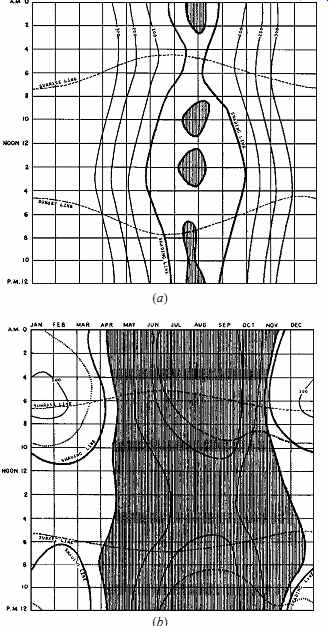
FIG. 2 Timetables of climatic needs for (a) New York City and (b) Miami, cities
representative of two of Olgyay's North American regional climate zones. Isolines
within the shaded regions represent air speeds; the lines outside of the shaded
areas represent solar radiation intensity. (From Victor Olgyay, Design with
Climate: Bioclimatic Approach to Architectural Regionalism; © 1963 by Princeton
University Press.)
Figure 2 shows Olgyay timetables for cities representative of two of the four climate zones shown in FIG. 1. These graphical views of thermal environmental needs are plotted across an entire year (the horizontal axis) for all hours of the day (the vertical axis). Those portions of the year within the bounds of the bold shading line require shade for thermal comfort. The darker-shaded (overheated) zones are bounded by an isoline that corresponds to a temperature of about 78-82ºF (26-28ºC), depending upon relative humidity. At higher temperatures, there is a need for air motion as well as shade to remain comfortable outdoors. Areas farther within the overheated zone correspond to thermal comfort needs for 300 and 700 fpm (1.5 and 3.6 m/s) air velocities. An occupancy schedule for a proposed building can be overlaid on such a timetable, providing insights into climate/building interactions.
The timetable for New York City (FIG. 2a) shows that about one-fifth of the year requires shade for outdoor comfort, with most of the hours from mid-July to mid-August falling in the over heated period. Little relief can be expected at night in summer. Perhaps one-third of the year is "too cold," with temperatures too low for shirtsleeve comfort outdoors and requiring more than 300 Btu/h ft 2 (960 W/m2) of radiation, an unlikely solar bounty during New York winters.
The timetable for Miami, Florida (FIG. 2b), shows that about four-fifths of the year demand shade for outdoor comfort, and about three-fifths are in the overheated period. A large portion of the year needs over 700 fpm (3.6 m/s) wind, with these hours occurring both during the day and at night.
There is also a need for wind to counteract high vapor pressure (humidity), independently of high temperature. Clearly, wind is important to comfort in Miami in any unconditioned building. There is no such zone as "too cold" there.
Olgyay's climatic timetables provide a graphical view of outdoor conditions relative to thermal comfort for four key climate regions (FIG. 1). Of these four, the New York timetable suggests an emphasis on space heating but a need for cooling as well. In Miami, the focus is upon shading and cooling. Several design strategies can utilize the ambient climate as a heat source or sink for heating and for cooling.
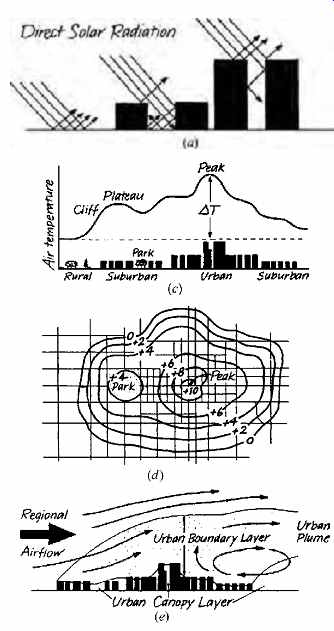
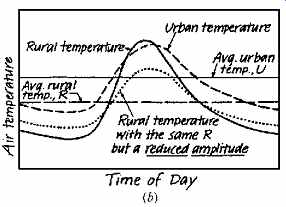
FIG. 3 Urban heat island: a densely occupied area with a temperature distinctly
higher than that of the surrounding rural area. (a) Direct solar radiation
is likely to be reflected within the city, thereby increasing solar heat gain
in urban areas. (b) Temperature records at a rural site (solid line) and in
the center of a city (dashed line) during a typical night and day. The city's
heat-conducting materials and thin cloud of polluted air acting alone would
not change the average air temperature but would reduce the day-night difference
(the dotted line). In addition, the heat from increased solar gain and city-specific
heat sources (cars, buildings) warms the air at all hours, producing the observed
urban record (dashed line). (c) Idealized profile of the air temperature difference
between urban and rural areas at times of peak differences-calm, clear nights.
(d) Based upon (c), typical isotherms (lines of equal temperature) provide
a "contour map" of the urban
heat island. (e) The urban heat island can affect the countryside "downstream."
2. CLIMATES WITHIN CLIMATES
The climate at a particular site can be quite different from the climate data that are published as being representative of an entire region. This is particularly evident when visiting a site where a neighboring hill blocks wind or winter sun, or an adjacent lake cools summer breezes or adds a damp chill to the winter air. Such local variations constitute microclimates, with some characteristic distinctly different from those of the larger macroclimate. The characteristics of a microclimate are influenced by the interaction of the characteristics of both the site and the macroclimate:
Site Characteristics | Climate Characteristics
Soil type Sun
Ground surface Air temperature
Topography Humidity
Vegetation Precipitation
Water bodies/flows Air motion
Views Air quality
Human effects (heat, noise, etc.)
Most urban sites are under the influence of an urban sub-climate that differs from the conditions of the surrounding countryside unaffected by urbanization. Probably the best-known urban climate feature is the heat island. Urban heat island effects are summarized in Table 1 and FIG. 3. Designers should note that city climatological stations are often located at nonurban sites, such as an outlying airport, masking the effects of a heat island.
The most obvious reason for a city's relative year-around warmth is its concentration of heat sources: the air conditioners, furnaces, and electric lighting in buildings and internal combustion engines in cars. This urban and industrial heat production is shown in Table 2 and FIG. 4. It appears that cities and industrial regions of the world release less internal heat per capita as people live and work closer together-although the heat density (temperature) is greater. Commercial and industrial cities release more heat for a given population density, and tropical cities release less, while still conforming to the pattern that greater compactness permits less energy use per capita.
Table 1 Average Changes in Climate Effects Caused by Urbanization
Table 2 Heat Generated within Cities
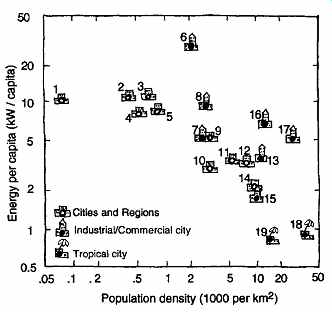
FIG. 4 Population density and energy use per capita for 19 cities and regions.
Numbers refer to locations in Table 2.
The heat island effect is influenced by both density and energy use. (Data with permission from Lowry and Lowry, 1995.)
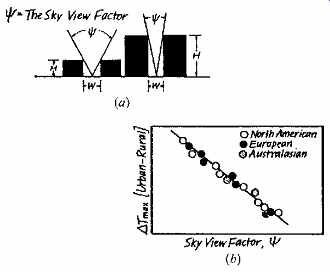
FIG. 5 The urban heat island effect is particularly strong on calm, clear
nights. (a) With a greatly reduced "sky view factor" (Ψ) to the
cold night sky, the walls and floors of urban canyons (the right part of the
sketch) cannot lose heat as readily as can the open countryside or less dense
suburban areas (the left part of the sketch). (b) The more narrow the Ψ,
the more pronounced is the effect (ΨT) of the urban heat island in cities
throughout the world.
Rain that falls on a city can be an effective evaporative cooling mechanism, especially as water evaporates from wet surfaces. Yet streets and buildings are usually designed to shed water quickly and thoroughly, sending rainwater into storm sewers instead of letting it evaporate slowly in the wind and sun. As a result, evaporative cooling from these surfaces is minimized.
A city also changes the overall cooling action of the wind by channeling it into narrow streets. The geometry of high vertical walls and narrow streets also increases summer heat collection in cities as the high sun is reflected downward to be absorbed and then reradiated by the often rocklike streets and building surfaces. In winter, however, this geometry puts most urban surfaces at a solar disadvantage because the low sun strikes only the upper portion of south-facing walls. A reduction in radiant heat loss at night, caused by this lack of access to the sky, is a key element in the formation of the urban heat island, as summarized in FIG. 5. Sky access is discussed in more detail in Section 6.
A more subtle urban climate influence is contaminated air. Small particles in a city's air can keep some sunlight from reaching the city, yet can also help to keep the city's heat from radiating outward.
These particles also form additional nuclei for fog droplets. Table 1 suggests that fog may occur in a city in winter up to twice as often as in the surrounding countryside. Trees and greenery, which can act as crude filters of airborne dust, are not as available in a city.
The city thus modifies its climate from that of its surroundings. In winter, the city's factories, vehicles, surface materials, and geometry combine to increase temperature and reduce the amount of energy needed for heating buildings. The typical means of providing needed winter heating (fossil fuel-burning heating equipment and power plants) contribute to airborne particles and urban fog.
Solar-assisted heating would diminish this pollution-and with less air pollution, more sun would reach a solar collector. However, the greater the population density, the more difficult is access to winter sun, especially at latitudes farther from the equator, where winter heating is most needed. High buildings readily block low sun altitudes.
In summer, the city's internal heat makes things worse. Air conditioners add their own pro cess heat to the building heat that they pour into the air; their appetite for electricity taxes power plants, in turn adding vastly more waste heat. Again, solar energy can help, this time by generating photovoltaic (PV) electricity to run air conditioners. High summer sun angles make solar access much less problematic. The stronger the sun, the more electricity is produced for air conditioners and other loads. PV arrays are currently high in first cost, but are noiseless, emit no exhaust gases, and add no internally generated heat to the summer air.
Site- and urban-planning responses to these urban climate characteristics can sometimes lead in contradictory directions. For example, the provision of greenways within cities would bring softer ground surfaces cooled in summer by shading, breezes, and evaporation. However, the winter impact of greenways might be an increase in fog via evaporation of retained storm water; or per haps fog would be discouraged locally by increased wind speeds in channels formed by the greenways.
The summer impact of a greenway is also mixed; changes in comfort would depend upon the particular combination of increased humidity and cooler temperature a greenway produces. On balance, a greenway within a city seems to be a positive and aesthetic step in ameliorating the urban climate.
While considering how the sun, wind, and other climate elements can be utilized on a site for the benefit of a building, it is important to remember the need to protect the access of others to these same shared resources. In "The Tragedy of the Commons" (1968), Garrett Hardin writes about the commons as publicly owned meadows shared by many herders. Each herder realizes that his personal wealth will increase as animals are added to his herd, so all herders increase their livestock. The meadow capacity, however, does not increase; overgrazing occurs, and as a result the commons become unable to support any animals. The following discussions of sun, air, and water resources available to a site are influenced both by the "private" needs of a building and the "public" patterns of resource availability, which should remain accessible to all.
3. BUILDINGS AND SITES
Buildings are temporary occupants of their sites.
The arrival of a building usually produces rapid and dramatic changes to the biological systems on a site, to the microclimate, and often to the surface geology. Buildings are guests, sites are hosts; a fundamental design question is, how can the two most productively coexist? A site offers a building earth for support, as a potential heat source and heat sink, and for the growth of plants where building density permits.
Sounds on a site depend upon the context, urban or rural. Water is somewhere below a site, flows across it, falls on it as rain, and perhaps collects on its surface. Wind moves erratically across a site.
Solar energy arrives in diurnal and seasonal cycles.
Long-term patterns of sun, wind, and water are steady and generally predictable, although great variations can occur over shorter (daily, monthly, annual) time spans. At some level, an ecosystem of life is already established.
During construction a building arrives, bringing with it people and vehicles, a flow of materials into and out of the site, sounds of activity, and imported utility services such as electricity, water, and natural gas. The building offers the site electric light by night, a continuous flow of heat (to or from), a radical change in water flows (both at and outside of the building envelope), and liquid and solid wastes (or nutrients, depending upon one's viewpoint). In our society, the waste outflows are most often whisked off for treatment "elsewhere." When a site is larger than its building, both may be designed to improve building performance and user experiences. Large sites offer smaller buildings the opportunity to accept, filter, or block sun, wind, sound, and rainwater to make effective use of on-site resources. Vegetation, ground forms, and orientation, as well as roofs, walls, and floors, can play a role in this interaction.
When a building fills its site, opportunities for on-site resource use are more limited. Because buildings that completely fill sites are often located in densely built-up areas, less wind is available around the building walls, and solar radiation may be blocked. The built-upon earth is less able to act as a heat sink or absorb water. The building roof often provides the major opportunity to receive sun and rain and discharge heat to the wind. It may offer the only opportunity to grow plants on the site. In dense urban areas, the future roofscape will be dominated by climate-building interactions: solar collection, rain collection, heat rejection, water treatment, and gardens. Compared to today's urban roofscape dominated by horizontal black or gray surfaces behind parapet walls, this represents a dramatic design opportunity for aesthetic, social, and technical change.
4. ANALYZING THE SITE
After recognizing the resources that exist on and around a site, a designer then decides how best to integrate these resources into the building design while making the building and site a successful addition to the larger patterns of the surroundings.
Schematic site plans are typically used as a kind of inventory; overlaid bubble diagrams can test possible design arrangements that relate rooms or functions to their surroundings in the plan view.
Sun and wind conditions (in both summer and winter), noise sources, and water runoff patterns are often included in a schematic plan. It is particularly important to identify microclimates on the site, the places that have special characteristics differing from the regional climate. Microclimates can present opportunities for an expanded comfort zone: more sun in cool periods, more wind in warm periods.
Microclimates can sometimes provide building sites where less energy is consumed because the winter is warmer or the summer cooler. Microclimates can also present problem areas to be avoided for buildings or outdoor activity, or where special design measures need to be taken to correct their difficulties.
Microclimates on a site are not limited to those visible on the surface (in plain view). Conditions of privacy and accessibility, view, heat, light, air motion, sound, and water all change with vertical distance from the surface (FIG. 6a). To minimize energy consumption for constructing and using buildings and to integrate buildings with their surroundings, the conditions best suited to various functions should approach the characteristics of the layer of the site in which they are located.
Consequently, both vertical and horizontal site analyses are needed. A lecture hall, requiring both an acoustically isolated and a closely controlled environment, is an obvious candidate for the subsurface layer.
Electrical equipment, which benefits from a cool environment, is also suitable for the subsurface layer.
One building whose form responds to these layers is Boston's City Hall (FIG. 6b). Activities with the most frequent public interaction are located near the surface, such as the skylit, high-ceilinged lobby, whereas special ceremonial functions are elevated to distinctive forms in the near-surface layer above. The city offices with less frequent public contact occupy several floors in the sky layer, where daylight is plentiful. Storage and mechanical functions, as well as parking, are in the subsurface layer. An aesthetic equivalent of this horizontal layering is architect Louis Sullivan's concept of a façade as a "base, body and capital."
5. SITE DESIGN STRATEGIES
Sites can be organized to aid in heating, lighting, cooling, and controlling noise in buildings. A few of the most common site strategies are compared with their seasonal roles by Watson and Labs (1983) in FIG. 7. Later in this section, several of these strategies are discussed in more detail. The graphics in FIG. 8 suggest a focus upon housing but also apply to any function that can utilize an extended comfort zone.
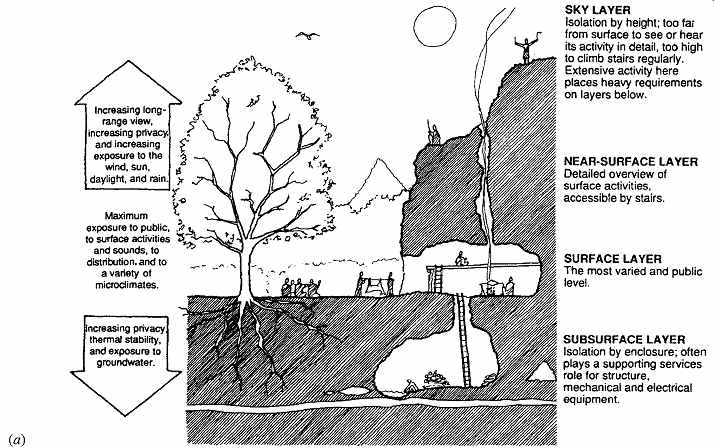
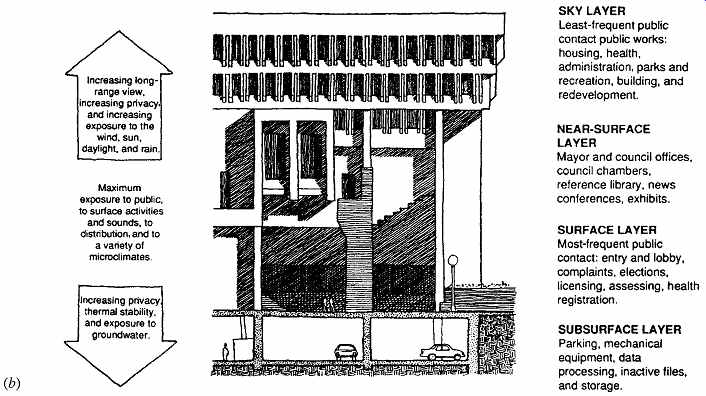
FIG. 6 (a) Characteristics of horizontal layers of a site. (b) Horizontal
layers and form: Boston City Hall, 1969. (Kallman, McKinnell and Knowles, Architects.)
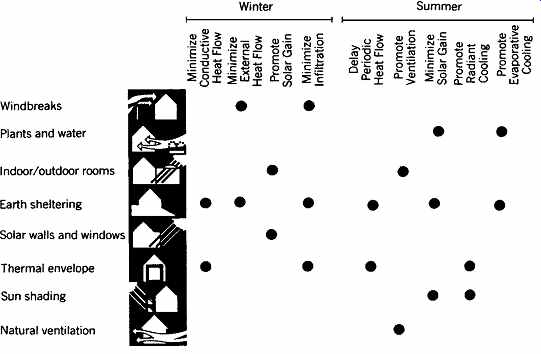
FIG. 7 Generic bioclimatic site design concepts and building strategies.
(Reprinted from Passive Cooling by permission of the publisher, American Solar
Energy Society.)
One example of how the information in Figs. 6 and 7 can be applied (and manipulated) in the planning of a building and its site is a house designed by Frank Lloyd Wright in the 1940s (FIG. 8). The direct gain of solar heat through its south-facing windows in winter makes this an early example of passive solar heating. (By contrast, active solar heating includes collectors and a single purpose storage volume for solar heat, such as a tank of water or a bed of heated rocks.) This house, known as the Solar Hemicycle, was built in 1948 near Madison, Wisconsin, which lies between the cool and temperate climate zones. Winter heating is the dominant thermal influence in this area. The house stands on a rise in the prairie, particularly vulnerable to winter winds. During construction, earth was scooped from in front of the south face of the house and bermed against the entire curved north wall, almost to roof level. Only a narrow strip of second-floor windows separates the berm from the roof. This berm and curve combination gives winter wind protection from the northeast to north west and provides further insulation for the north wall. The north wall is made of stone, which absorbs and stores winter solar radiation (heat) that comes in through the floor-to-ceiling, southeast-to-south west-facing glass. The concrete slab-on-grade first floor also stores solar heat in winter. The impression that this house and site are sun collectors is heightened by an entrance tunnel in the northeast end of the house that leads from the parking area through the berm and onto the sunny, protected south terrace overlooking a sunken "sun-trap" circular lawn. Passage from the cold north side through an even colder tunnel to the sunny south side prepares a visitor for the solar-heated interior.
This house plan is shorter in the north-south and longer in the east-west direction (about a 1:3 ratio). This elongation is typical of passive solar designs, which are able to store and use winter solar heat gain, and thus profit from having long south facing glass walls to act as passive collectors. Had these large windows been well insulated at night and the roof and walls insulated to current standards, this house would be a very up-to-date case study of passive solar heating.
In the Solar Hemicycle house, protection from summer overheating is provided by an overhang along the south glass walls, as well as by the shaded and cool thermal mass of the north stone/berm wall combination. The high windows in both the north and south walls allow warm air to rise and escape.
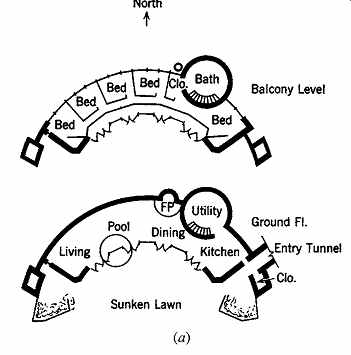
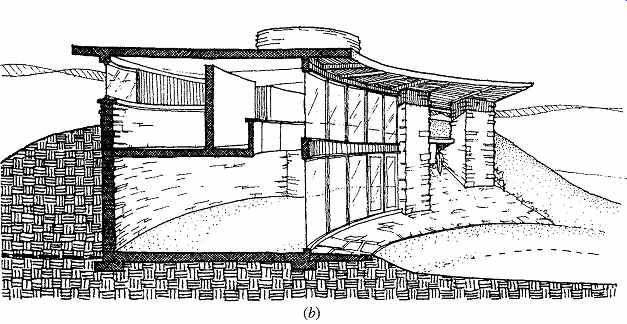
FIG. 8 An early passive solar-heated home, Frank Lloyd Wright's Solar Hemicycle
(Jacobs House II) near Madison, Wisconsin. The house was designed in the early
1940s and built in 1948. (a) Floor plans. (b) Section-perspective, looking
east toward the entry tunnel in the berm wall.
6. DIRECT SUN AND DAYLIGHT
The Earth actually receives only a very small percentage of the sun's daily energy output. This small portion, however, is critically important to life on Earth. Almost all of today's energy sources have the sun as an ancestor. Fossil fuels are solar energy that has been concentrated by time and geologic conversion. Biomass, hydropower, and wind power represent shorter-term concentrations of solar energy.
Even without concentration, the renewable solar resource is often more than adequate for building heating and lighting.
The amount of solar energy available at any given site varies both seasonally and daily. Typically, the closer the sun is to a position directly overhead, the more solar energy that reaches a horizontal site. Fortunately, sunlight's embodied heat energy is not its only resource; direct sun is our most intense light source. Indirect sun, such as on an overcast day or from the clear north sky, is a wonderfully diffuse and readily utilized light source.
(a) Access to Light and Sun
The value of daylight (and fresh air) to buildings has long been recognized in zoning laws, which require that minimum distances (setbacks) be maintained between a building and the property line in lower density areas. Height restrictions often accompany these setbacks, defining a maximum buildable volume that a building can fill (FIG. 9). As buildings become taller and density increases, daylight reflecting down between buildings is diminished; in response, the maximum buildable volume becomes narrower as it rises.
When direct sun in winter is desirable at the ground floor of all sites, the buildable volume is sharply reduced in height due to the low angle of the winter sun in northern latitudes. Protection of this most-restricted buildable envelope, called the solar envelope, is at present rarely mandated, but solar access ordinances have been enacted for residential zones in some cities. The most restrictive feature of the solar envelope is the low slope of its northern face, usually corresponding to the altitude of the sun above the horizontal for about 2 hours before and after noon on December 21. This feature allows 4 hours of access to direct sun for a neighbor on the site just to the north, on even the shortest day.
A brief history of daylight and solar access regulations and an overview of current design guidelines are given in DeKay (1992). Figure 10 shows the application of six variations of regulations on an urban block at 40º N latitude, elongated east-west. The east-west streets are wider than the north-south streets. Further development of the solar envelope is shown in Figs. 11 and 12, based upon the work of Knowles (1981). Clearly, winter solar access is closely related to maximum density of development.
For daylight access, building surfaces can be almost as important as building geometry. The importance of light reflected from vertical and horizontal surfaces is apparent in daylighting calculation methodologies. Lighter-colored surfaces produce more internal daylighting, especially in crowded urban conditions, where a view of the sky from windows is not common. An increase in daylight results for all surfaces on an urban street if the building and site surfaces have light colors. This can conflict with the use of planting for shading and evaporative cooling, although lighter-colored groundcover plants are available.
Although daylight reflected in a diffused way from building and ground surfaces is a potential benefit, harsh specular reflections of direct sun from mirror surfaces are often unwelcome. See Section 3.6(f).
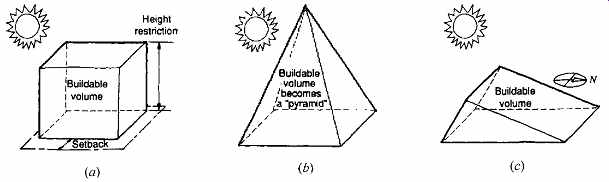
FIG. 9 Protecting access to light and solar radiation. Three regulatory
approaches that compromise between private optima (e.g., maximum rentable floor
space) and public optima (e.g., daylight at street level). (a) Simple daylight
access, residential and low-rise commercial areas. (b) Daylight access in high-density
areas. (c) Access to direct sun for winter heating.
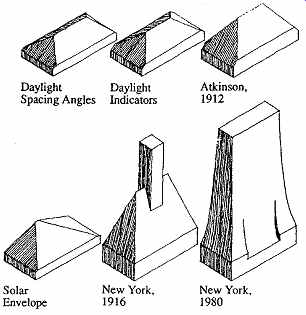
FIG. 10 Various approaches to defining maximum allowable building envelopes
for daylight access. These envelopes are applied to a 200-ft × 400-ft (61-m
× 122-m) block at 40° N latitude.
The east-west streets (along the longer side) are 65 ft (20 m) wide; the north-south streets are 45 ft (14 m) wide. In this case, "daylight spacing angles" and "daylight indicators" produce nearly identical envelopes. (From DeKay, 1992, with permission of the American Solar Energy Society.)
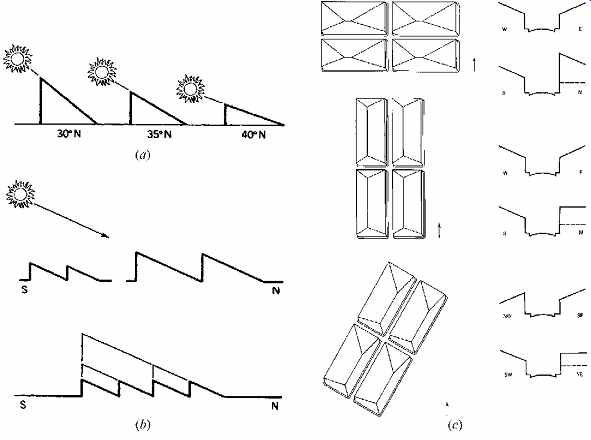
FIG. 11 These solar envelopes are refinements of the solar access "pyramid" of
FIG. 9. (a) The slope of the solar envelope changes with latitude. (b) The
larger the site, the greater the buildable volume of the solar envelope. (c)
Solar envelopes for various individual site orientations. (Reprinted, by permission
of R. Knowles, from Sun, Rhythm, Form; © 1981, MIT Press.)
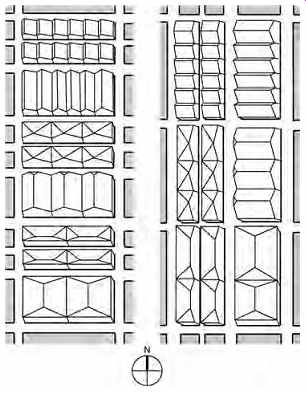
FIG. 12 Solar envelopes for east-west elongated blocks (left) and for north-south
elongated blocks (right). (Reprinted, by permission of R. Knowles, from Sun,
Rhythm, Form; © 1981, MIT Press. Redrawn by Nathan Majeski.)
(b) Charting the Sun
For site planning, one of the earliest tasks is to deter mine when direct sun reaches a building or space- such as a playground, deck, or courtyard-on a site. Information on solar geometry is presented in Section 6. Numerical data on sun position and intensity. Details of how a building can utilize the sun are found in later sections on solar space heating, solar water heating, and daylighting. Effective design for solar utilization, how ever, begins with an understanding of the basics.
The chart in FIG. 13 shows the sun's position for 40º N latitude and also shows, for the 6 hours of greatest insolation, what percentage of clear day insolation is gained each hour by an unshaded south-facing vertical window. The emphasis on a southern orientation calls attention to its useful characteristic of receiving more sun in winter and less sun in summer than any other orientation. To convert these percentages to actual heat gains, see the numerous tables in Appendix C with data for clear days at a given latitude and the table for an average day by climate station (January and July only).
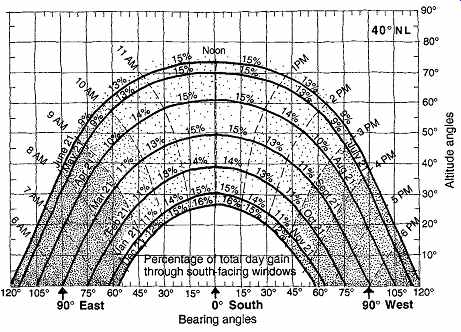
FIG. 13 Sun chart for 40° N latitude showing the approximate percentage
of clear-day insolation for south-facing windows for each of the 6 maximum
hours of sun each month. (From Edward Mazria and David Winitsky. 1976. Solar
Guide and Calculator. Center for Environmental Research, University of Oregon.)
(c) The "Band of Sun"
A building section drawing can be a powerful site analysis tool. A north-south section is drawn through a proposed building and its site. At three times of year (each solstice and the equinox), the noon solar altitude angle is determined, as in FIG. 14. Then the band of sun that strikes the building and site is drawn, incoming at the noon altitude. The portion of this available direct radiation that is used by the building and site can then be analyzed. The more of the band that is unused in each season, the higher the potential for redesign in order to better utilize the solar resource. This analysis helps to show how wintertime solar utilization depends upon lower sun altitudes, and summer time uses depend upon higher altitude angles.
(d) Skylines and Winter Sun
The skyline as actually seen from a given location on a site can be charted to determine access to direct sun at any time of the year (FIG. 15). Such an obstruction analysis should precede the placing of any solar collector, whether it is a south-facing window or a manufactured collector. Seasonal obstructions within the six "best" collection hours ( 9:00 A.M. to 3:00 P.M.) are particularly serious and should be minimized when siting a collector.
At the same time, consideration of neighbors' access to direct sun is appropriate. This can be checked by charting another skyline somewhere along the northern boundary of a site. The outline of the building being designed should be included on this skyline, and can then be modified, if necessary, to preserve solar access for the neighbor.
The location charted in FIG. 15 is quite a good one for a summer solar usage, such as a swimming pool heater, or for a PV array that serves summer loads such as air conditioners. It is also a possible location for a solar collector for domestic water heating, which will work well during the six months from March through September; obstructions are few within this period. However, it is quite poor for winter solar collection, allowing only about one-fifth of the potential solar gain in the November to January period.
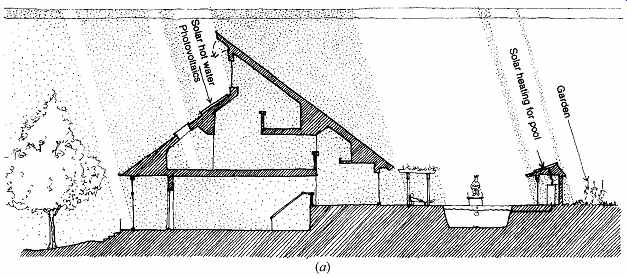
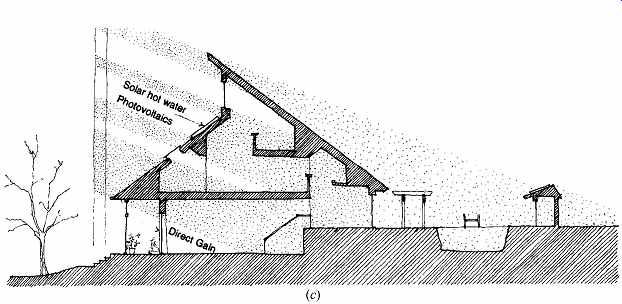
FIG. 14 The band of sun available to a proposed building is charted at solar
noon on a north-south section. (a) The summer solstice, where most-optimum
collecting surfaces are at near-horizontal tilt angles. (b) The equinox. (c)
The winter solstice, where most optimum collecting surfaces are at near-vertical
south-facing tilt angles.
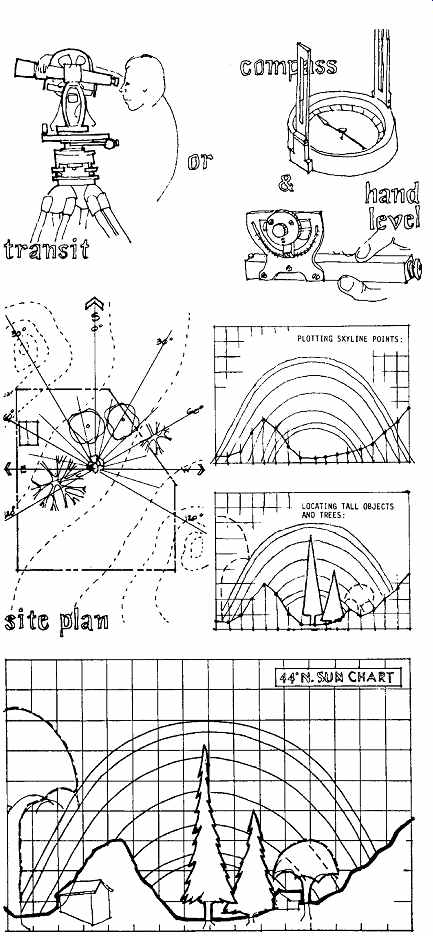
FIG. 15 Charting the skyline from a specific site position. (From Edward
Mazria and David Winitsky. 1976. Solar Guide and Calculator. Center for Environmental
Research, University of Oregon.)
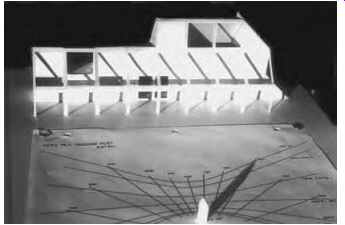
FIG. 16 A model of a small building with a glazed open-frame circulation
space on the south side is observed at the sun's position at 3:00 P.M. on December
21 through the use of a sunpeg chart.
(e) Sun and Shadows: Model Techniques
The graphic site analysis techniques just de scribed have a limitation: Each graph applies only to one particular location on a site. To study multiple locations, multiple graphs must be constructed. By contrast, a three-dimensional model used in conjunction with a sun shadow plot (FIG. 16) can yield three-dimensional sun penetration patterns as they change over time, for any position, indoors or out, in/on the model. Models are initially time-consuming to build but can save time when considering alter native locations on a site, alternative window and space combinations, alternative shading devices, and so on. Perhaps most important to a designer, models suggest three-dimensional solutions, because one is testing a volume rather than merely a plan or section. How ever, if obstructions to sun exist far from a site (such as nearby mountains), it might be better to rely on graphs rather than trying to include such large obstructions on a (quickly becoming huge) model.
A sunpeg chart, correctly attached to a model of any scale, allows a designer to quickly determine exact sun penetration and shadow patterns at many times for any date. These plots are one of the most important tools for a concerned designer, both early and late in the design process.
In FIG. 16, a model is observed at a sun position corresponding to 3:00 P.M. on December 21. At this end of the 6-hour period of best collection, it can be seen that sun still fills the south-side glazed open frame circulation space and enters spaces beyond through south openings. It can also be seen that passing from these spaces into the circulation space might involve considerable glare because the sun is so low in the sky. In such a case, vertical fins inside the south glazing would help intercept and diffuse direct sun while still permitting solar heat gain.
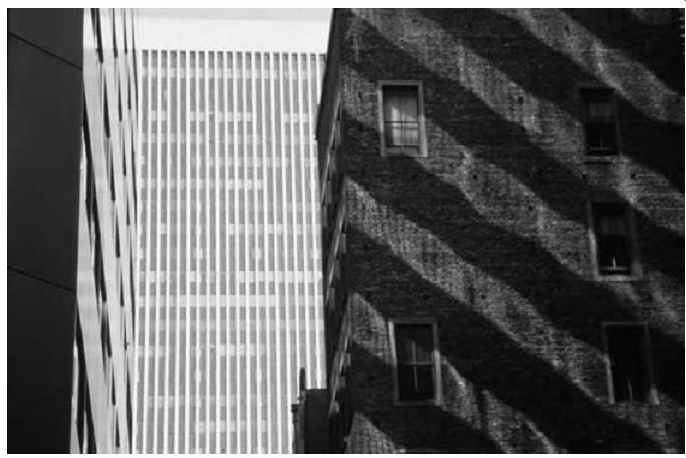
FIG. 17 Mirror-glass windows in a newer office building (left) in San Francisco,
California, cast strong reflections on the north- and west facing walls of
an older building next door. Although this reflected radiation/heat might be
welcome in winter, the resulting glare can be intense. In summer, the older
building is particularly disadvantaged by additional thermal loads.
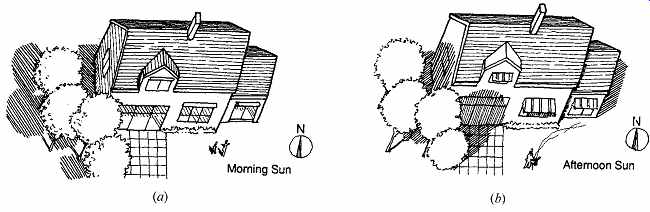
FIG. 18 Selective protection from reflections. (a) The trees standing west
of this south window wall do not interfere with solar access during the best
hours for solar collection (around noon), nor do they prevent early morning
sun from entering the windows.
Any reflections of the early morning sun are intercepted by the trees before they can annoy those in nearby buildings. (b) The late afternoon sun is blocked by the trees before either solar gain or reflections can occur.
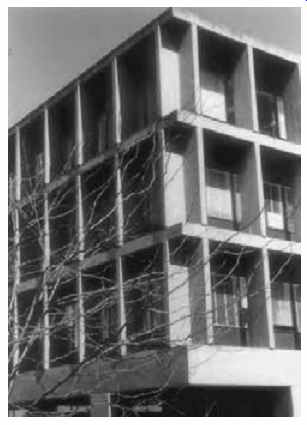
FIG. 19 The "eggcrate" shading devices shown on the south west
corner of this University of Oregon building reduce solar heat gains by blocking
acute sun angles from either side of the window. Different shading devices
are appropriate for different façade orientations.
(f) Controlling Solar Reflections
The use of highly reflective (or "mirror") glass to reduce envelope heat gain in office buildings has increased the frequency of annoying solar reflections from buildings (FIG. 17). Large areas of non-mirror glazing, such as found on passive solar-heated buildings, can also cause reflection problems. The farther the sun's rays are from being perpendicular (or normal) to any surface, the more radiation is reflected, rather than absorbed or transmitted, by that surface. Thus, the intensity of reflection is greatest (and the transmission of solar gain is least) when the sun's rays are nearly parallel to a surface.
Because the most intense reflections occur when the sun's rays are nearly parallel to a wall, such reflections are fairly easily blocked or intercepted. For example, foliage (FIG. 18) can intercept reflected sunlight from a south-facing window with out blocking solar collection during the best hours.
Another common approach is to use external projections around windows, as in FIG. 19. The use of a model and a sunpeg chart is a good way to explore reflections. Using mirrored surfaces to represent reflective glass on a model will make resulting reflections evident along their three-dimensional path.