AMAZON multi-meters discounts AMAZON oscilloscope discounts
1. Introduction
If water of high salinity is separated from water of low salinity via a semipermeable membrane, a natural process of transfer of water will occur from the low-salinity side to the high-salinity side of the membrane until the salinity on both sides reaches the same concentration. This natural process of water transfer through a membrane driven by the salinity gradient occurs in every living cell; it is known as osmosis.
The hydraulic pressure applied on the membrane by the water during its transfer from the low-salinity side of the membrane to the high-salinity side is termed osmotic pressure. Osmotic pressure is a natural force similar to gravity and is proportional to the difference in concentration of total dissolved solids (TDS) on both sides of the membrane, the source water temperature, and the types of ions that form the TDS content of the source water. This pressure is independent of the type of membrane itself.
In order to remove fresh (low-salinity) water from a high-salinity source water using membrane separation, the natural osmosis-driven movement of water must be reversed, i.e., the freshwater has to be transferred from the high-salinity side of the membrane to the low-salinity side. For this reversal of the natural direction of freshwater flow to occur, the high-salinity source water must be pressurized at a level higher than the naturally occurring osmotic pressure ( FIG. 1). If the high-salinity source water is continuously pressurized at a level higher than the osmotic pressure and the pressure losses for water transfer through the membrane, a steady-state flow of freshwater from the high-salinity side of the membrane to the low-salinity side will occur, resulting in a process of salt rejection and accumulation on one side of the membrane and freshwater production on the other. This process of forced movement of water through a membrane in the opposite direction to the osmotic force driven by the salinity gradient is known as reverse osmosis (RO).
The rate of water transport through the membrane is several orders of magnitude higher than the rate of passage of salts. This significant difference between water and salt passage rates allows membrane systems to produce freshwater of very low mineral content.
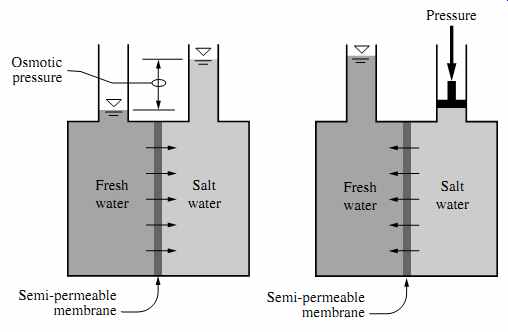
FIG. 1 Osmosis and reverse osmosis.
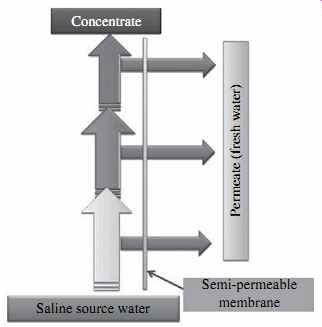
FIG. 2 Reverse osmosis process.
The applied feed water pressure counters the osmotic pressure and overcomes the pressure losses that occur when the water travels through the membrane, thereby keeping the freshwater on the low-salinity (permeate) side of the membrane until this water exits the membrane vessel. The salts contained on the source water (influent) side of the membrane are retained and concentrated; they are ultimately evacuated from the membrane vessel for disposal. As a result, the RO process results in two streams-one of freshwater of low salinity (permeate) and one of feed source water of elevated salinity (concentrate, brine or retentate), as shown in FIG. 2.
While semipermeable RO membranes reject all suspended solids, they are not an absolute barrier to dissolved solids (minerals and organics alike). Some passage of dissolved solids will accompany the passage of freshwater through the membrane. The rates of water and salt passage are the two key performance characteristics of RO membranes.
2. Reverse Osmosis Membrane Structures, and Materials
Reverse osmosis membranes differ by the material of the membrane polymer and by structure and configuration. Based on their structure, membranes can be divided into two groups: conventional thin-film composite and thin-film nanocomposite. Based on the thin-film material, conventional membranes at present are classified into two main groups: polyamide and cellulose acetate. Depending on the configuration of the membranes within the actual membrane elements (modules), RO membranes are divided into three main groups: spiral-wound, hollow-fiber, and flat-sheet (plate-and-frame).
2.1 Conventional Thin-Film Composite Membrane Structure
The reverse osmosis membranes most widely used for desalination at present are com posed of a semipermeable thin film (0.2 µm), made of either aromatic polyamide (PA) or cellulose acetate (CA), which is supported by a 0.025- to 0.050-mm microporous layer that in turn is cast on a layer of reinforcing fabric ( FIG. 3 for a membrane with an ultrathin PA film). The 0.2-µm ultrathin polymeric film is the feature that gives the RO membrane its salt rejection abilities and characteristics. The main functions of the two support layers underneath the thin film are to reinforce the membrane structure and to maintain membrane integrity and durability.
The dense semipermeable polymer film is of a random molecular structure (matrix) that does not have pores. Water molecules are transported through the membrane film by diffusion and travel on a multidimensional curvilinear path within the randomly structured molecular polymer film matrix.
While the thin-film RO membrane with conventional random matrix-based structure shown in FIG. 3 is the type of membrane that dominates the desalination industry, new thin-film membranes of more permeable structure are currently under development in research centers worldwide.
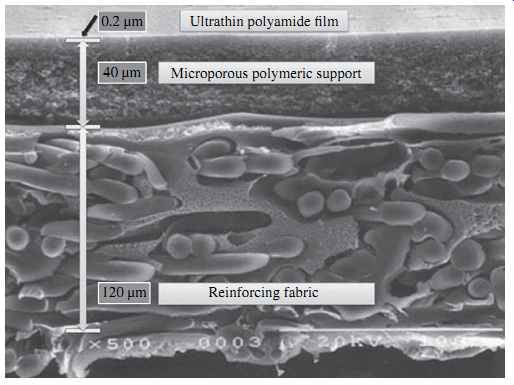
Fig. 3: Structure of a typical RO membrane.
2.2 Thin-Film Nanocomposite Membrane Structure
Nanocomposite membranes either incorporate inorganic nanoparticles within the traditional membrane polymeric film structure ( FIG. 4) or are made of highly structured porous film consisting of a densely packed array of nanotubes (FIG. 5). In FIG. 4, part A shows the thin film of a conventional PA membrane, supported by the polysulfone support layer. Part B shows the same type of membrane with embedded nanoparticles (labeled "NP").
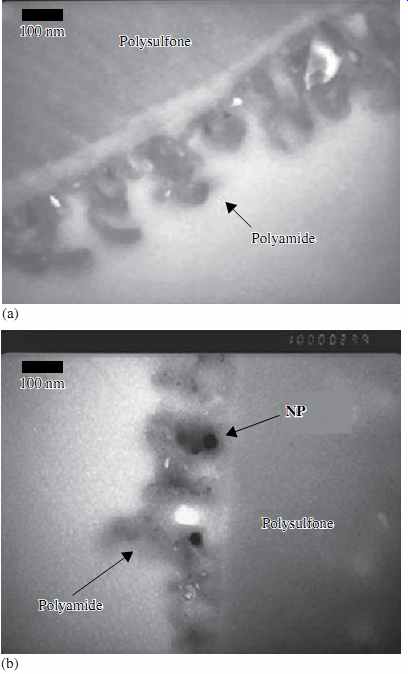
FIG. 4 Polyamide RO membrane with nanoparticles.
Nanocomposite membranes reportedly have a higher specific permeability (i.e., ability to transport more water through the same surface area at the same applied pressure) than conventional RO membranes at comparable salt rejection. In addition, thin-film nanocomposite membranes have comparable or lower fouling rates in comparison to conventional thin-film composite RO membranes operating at the same conditions, and they can be designed for enhanced rejection selectivity of specific ions.
If membrane material science evolved to a point where the membrane structure could be made of tubes of completely uniform size, theoretically the membrane could produce up to 20 times more water per unit surface area than the RO membranes commercially available on the market today. As membrane material science evolves toward the development of membranes with more uniform structure, the further development of RO desalination membrane technology has the potential to yield measurable savings in terms of water production costs.
2.3 Cellulose Acetate Membranes
The thin semipermeable film of the first RO membranes-developed in the late 1950s at the University of California, Los Angeles-was made of cellulose acetate (CA) polymer.
While CA membranes have a three-layer structure similar to that of PA membranes, the main structural difference is that the top two layers (the ultrathin film and the microporous polymeric support) are made of different forms of the same CA polymer. In PA membranes these two layers are made of completely different polymers-the thin semi permeable film is made of polyamide, while the microporous support is made of polysulfone (see FIG. 3). Similar to PA membranes, CA membranes have a film layer that is typically about 0.2 µm thick; but the thickness of the entire membrane (about 100 µm) is less than that of a PA membrane (about 160 µm).
One important benefit of CA membranes is that the surface has very little charge and is considered practically uncharged, as compared to PA membranes, which have negative charge and can be more easily fouled with cationic polymers if such polymers are used for source water pretreatment. In addition, CA membranes have a smoother surface than PA membranes, which also renders them less susceptible to fouling.
CA membranes have a number of limitations, including the ability to perform only within a narrow pH range of 4 to 6 and at temperatures below 35°C (95°F). Operation outside of this pH range results in accelerated membrane hydrolysis, while exposure to temperatures above 40°C (104°F) causes membrane compaction and failure. In order to maintain the RO concentrate pH below 6, the pH of the feed water to the CA membranes has to be reduced to between 5 and 5.5, which results in significant use of acid for normal plant operation and requires RO permeate adjustment by addition of a base (typically sodium hydroxide) to achieve adequate boron rejection.
CA membranes experience accelerated deterioration in the presence of microorganisms capable of producing cellulose enzymes and bio-assimilating the membrane material. However, they can tolerate exposure to free chlorine concentration of up to 1.0 mg/L, which helps to decrease the rate of membrane integrity loss due to destruction by microbial activity.
Since CA membranes have a higher density than PA membranes, they create a higher head loss when the water flows through the membranes; therefore they have to be operated at higher feed pressures, which results in elevated energy expenditures.
Despite their disadvantages, and mainly because of their high tolerance to oxidants (chlorine, peroxide, etc.) as compared to PA membranes, CA membranes are used in municipal applications for saline waters with very high fouling potential (mainly in the Middle East and Japan) and for ultrapure water production in pharmaceutical and semiconductor industries.
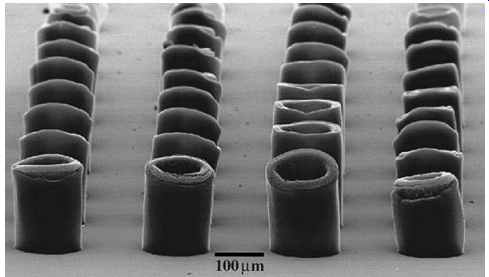
FIG. 5 Membrane with carbon nanotubes.
Table 1 [coming soon] Comparison of Polyamide and Cellulose Acetate Membranes
2.4 Aromatic Polyamide Membranes
Aromatic polyamide (PA) membranes are the most widely used type of RO membranes at present. They have found numerous applications in both potable and industrial water production. The thin polyamide film of this type of semipermeable membrane is formed on the surface of the microporous polysulfone support layer ( FIG. 3) by interfacial polymerization of monomers containing polyamine and immersed in solvent containing a reactant to form a highly cross-linked thin film.
PA membranes operate at lower pressures and have higher productivity (specific flux) and lower salt passage than CA membranes, which are the main reasons they have found a wider application at present. While CA membranes have a neutral charge, PA membranes have a negative charge when the pH is greater than 5, which amplifies co-ion repulsion and results in higher overall salt rejection. However, it should be noted that when the pH is lower than 4, the charge of a PA membrane changes to positive and rejection is reduced significantly, to lower than that of a CA membrane.
Another key advantage of PA membranes is that they can operate effectively in a much wider pH range (2 to 12), which allows easier maintenance and cleaning. In addition, PA membranes are not biodegradable and usually have a longer useful life-5 to 7 years versus 3 to 5 years. Aromatic polyamide membranes are used to produce membrane elements for brackish water and seawater desalination, and nanofiltration.
It should be noted that PA membranes are highly susceptible to degradation by oxidation of chlorine and other strong oxidants. For example, exposure to chlorine longer than 1000 mg/L-hour can cause permanent damage of the thin-film structure and can significantly and irreversibly reduce membrane performance in terms of salt rejection. Oxidants are widely used for biofouling control with RO and nanofiltration membranes; therefore, the feed water to PA membranes has to be dechlorinated prior to separation. A comparison of key parameters of polyamide and cellulose acetate RO membranes in terms of their sensitivity to feed water quality is presented in Table 1.
Mainly because of their higher membrane rejection and lower operating pressures, polyamide membranes are the choice for most RO membrane installations today.
Exceptions are applications in the Middle East, where the source water is rich in organics and thus cellulose acetate membranes offer benefits in terms of limited membrane biofouling and reduced cleaning and pretreatment needs.
Because of the relatively lower unit power costs in the Middle East, cellulose acetate membranes provide an acceptable tradeoff between lower fouling rates and chemical cleaning costs on one hand and higher operating pressures and power demand on the other. However, as newer generations of lower-fouling PA membranes are being introduced on the market, the use of CA elements is likely to diminish in the future.
3. Spiral-Wound, Hollow-Fiber, and Flat-Sheet RO Membrane Elements
The CA and PA membranes described in the previous section are configured into commercially available membrane elements that pack a large surface area and have standard sizes and performance. The two most widely used configurations of membrane elements at present are spiral-wound and hollow-fiber.
Until the mid-1990s, hollow-fiber elements were the most prevalent technology used for desalination, but at present the marketplace is dominated by spiral-wound RO membrane elements. Other configurations of membrane elements, such as tubular and plate-and-frame, have found application mainly in the food and dairy industries- they are practically never used in conventional municipal brackish or seawater desalination plants, because of their higher costs and equipment space requirements. Tubular membrane elements have very limited application at present and are not discussed in detail in this guide.
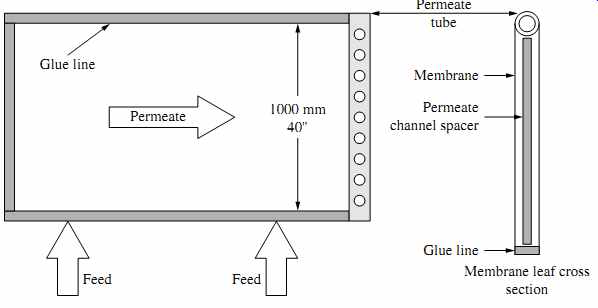
FIG. 6 Flat-sheet membrane envelope. (Source: Hydranautics.)
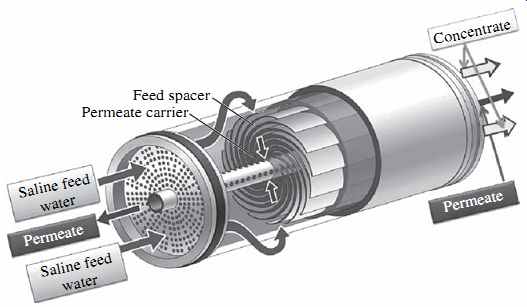
FIG. 7 Spiral-wound membrane element.
3.1 Spiral-Wound RO Membrane Elements
Spiral-wound membrane elements (modules) are made of individual flat membrane sheets that have the three-layer structure described in the previous section (i.e., ultra thin CA or PA film; microporous polymeric support; and reinforcing fabric-see FIG. 3). A typical 8-in.-diameter spiral-wound RO membrane element has 40 to 42 flat membrane sheets.
The flat sheets are assembled into 20 to 21 membrane envelopes (leafs), each of which consists of two sheets separated by a thin plastic net (referred to as a permeate spacer) to form a channel that allows evacuation of the permeate separated from the saline source water by the flat sheets (permeate carrier). Three of the four sides of the two-membrane flat-sheet envelope are sealed with glue and the fourth side is left open (FIG. 6). The membrane leafs are separated by a feed spacer approximately 0.7 or 0.9 mm (28 or 34 mils) thick, which forms feed channels and facilitates the mixing and conveyance of the feed-concentrate stream along the length of the membrane element ( FIG. 7). Membranes with the wider 34-mil spacers have been introduced relatively recently and are more suitable for highly fouling waters. In order to accommodate the wider spacers, fewer membrane leafs are installed within the same RO membrane module, which results in a tradeoff between reduced membrane fouling and lower membrane element productivity.
Pressurized saline feed water is applied on the outside surface of the envelope; permeate is collected in the space inside the envelope between the two sheets and directed toward the fourth, open edge of the envelope, which is connected to a central permeate collector tube. This collector tube receives desalinated water (permeate) from all flat-sheet leaves (envelopes) contained in the membrane element and evacuates it out of the element.
The assembly of flat-sheet membrane leafs and separating spacers is wrapped (rolled) around the perforated permeate collector tube. The membrane leafs are kept in the spiral-wound assembly with a tape wrapped around them and contained by an outer fiberglass shell. The two ends of each RO element are finished with plastic caps referred to as end caps, anti-telescoping devices, or seal carriers. The plastic caps are perforated in a pattern that allows even distribution of the saline feed flow among all membrane leafs in the element (FIG. 8). The plastic caps' flow distribution pattern varies between membrane manufacturers.
The reason the plastic caps are often also referred to as seal carriers is that one of their functions is to carry a chevron-type U-cup-style rubber brine seal that closes the space between the membrane and the pressure vessel in which the membrane is installed.
This seal prevents the feed water from bypassing the RO element (FIG. 9).
The source water flow is introduced from one end of the element and travels in a straight tangential path on the surface of the membrane envelopes and along the length of the membrane element (see Figs. 6 and 7). A portion of the feed flow permeates through the membrane and is collected on the other side of the membrane as freshwater. The separated salts remain on the feed side of the membrane and are mixed with the remaining feed water. As a result, the salinity of the feed water increases as this water travels from one end of the membrane element to the other. The rejected mix of feed water and salts exits at the back end of the membrane element as concentrate (brine).
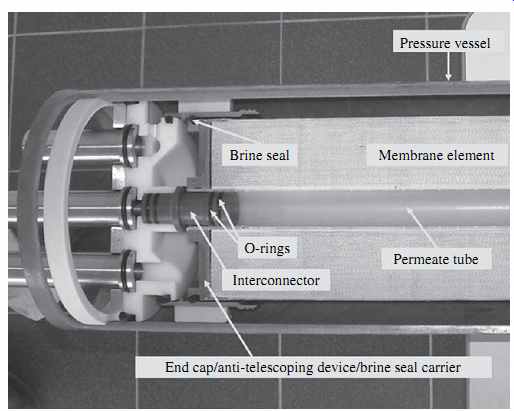
FIG. 8 Cross-section of an RO membrane element installed in a pressure vessel.
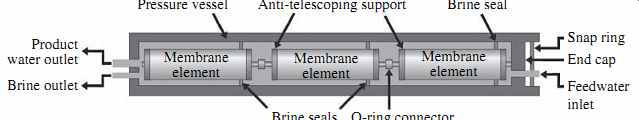
FIG. 9 Membrane elements installed in a pressure vessel.
As shown in Figs. 8 and 9, the permeate collector tubes of the individual RO membrane elements installed in the pressure vessel are connected to each other and to the permeate line evacuating the fresh water from the pressure vessel via interconnectors (adaptors) with integral O-rings that seal the connection points and prevent concentrate from entering the permeate collector tubes. The interconnectors with O-rings provide flexible connections between the elements, which allow for their limited movement within the vessel, for some level of flexibility in loading membranes and also facilitate handling transient pressure surges created in the vessels as a result of abrupt shutdown and start-up of the RO system. While FIG. 8 shows an interconnector to the permeate line, FIG. 10 depicts an interconnector between two RO elements.
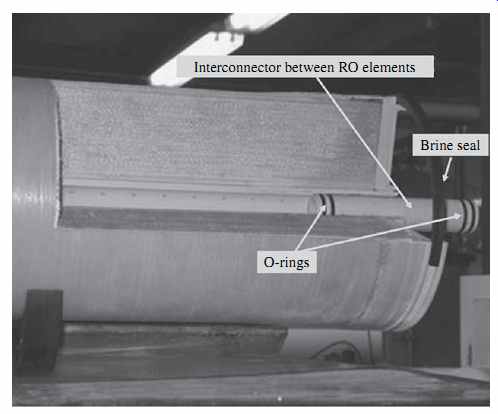
FIG. 10 Interconnector between RO elements.
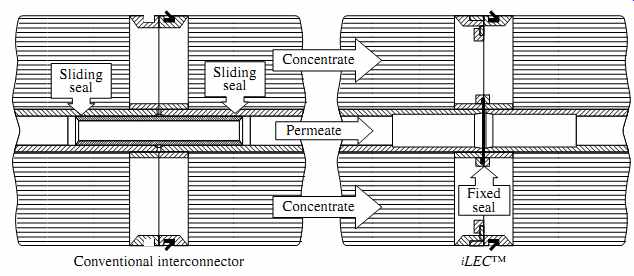
FIG. 11 Comparison of conventional and iLEC membrane interconnectors. (Source:
DOW FilmTec.)
Since broken O-rings and interconnectors are one of the most common operations challenges in RO systems, the Dow Chemical Company has introduced a different interconnection configuration (iLEC) between RO elements that requires the elements to have special interlocking end caps and allows them to be connected directly to each other rather than through conventional interconnectors ( FIG. 11). The end caps of the iLEC RO membrane elements are configured so that they can be interlocked by twisting the installed RO element until its end cap locks with the end cap of a previously installed element. The end caps of the two elements are connected by one O-ring only, which is integrated into the end cap and cannot be rolled or pinched during installation. This minimizes the wear and tear on the O-rings from hydraulic surges and reduces the pressure drop caused by conventional interconnectors.
Commercially available RO membrane elements are standardized in terms of diameter and length and usually are classified by diameter. Spiral-wound RO membranes are available in 2.5-in., 4-in., 6-in., 8-in., 16-in., 18-in., and 19-in. sizes. A typical 8-in. RO membrane element is shown in FIG. 12.
At present, the most widely used and commercially available RO elements have a diameter of 20 cm (8 in.), length of 100 cm (40 in.) and brine spacer thickness of 28 mils (0.7 mm). Standard 8-in. seawater and brackish water elements in a typical configuration of seven elements per vessel can produce between 13 and 25 m3/day (3500 and 6500 gal/day) and 26 and 38 m3/day (7000 and 10,000 gal/day) of freshwater (permeate), respectively.
Larger 16-in., 18-in., and 19-in. RO brackish and seawater membrane elements are also commercially available. However, to date these large elements have received limited full-scale application. While 8-in. elements and smaller can be handled manually by a single person ( FIG. 13), larger RO elements can only be loaded and unloaded by special equipment because of their significant weight.
Standard and large-size spiral-wound thin-film composite PA membrane elements have limitations with respect to a number of performance parameters: feed water temperature (45°C), pH (2 to 10), silt density index (less than 4), chlorine content (no measurable amounts), and feed water operating pressure (maximum of 41 or 83 bar/600 to 1,200 lb/in^2 for brackish and seawater RO membranes, respectively). A more detailed description of commercially available brackish and seawater membrane elements from key manufacturers is presented in Section 14.
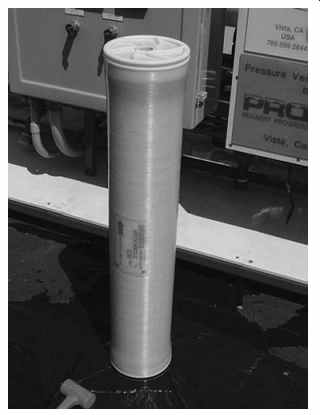
FIG. 12 Typical 8-in. membrane element.
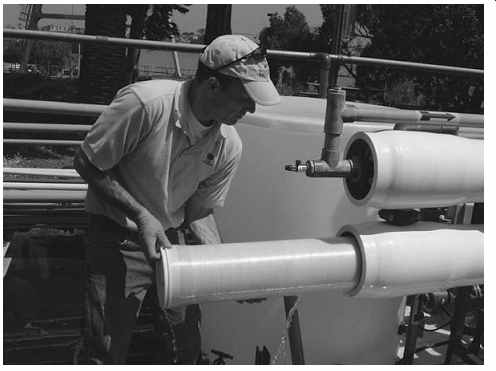
FIG. 13 Unloading an RO membrane element from a pressure vessel.
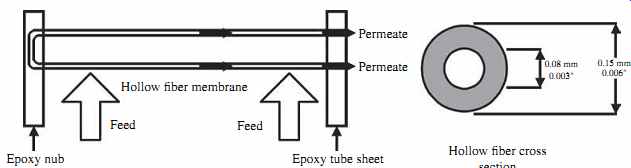
FIG. 14 Hollow-fiber RO vessel with two membrane elements. (Source: Toyobo.)
3.2 Hollow-Fiber RO Membrane Elements
In hollow-fiber membrane elements, the 0.1- to 1.0-µm semipermeable film is applied as a coating to the surface of hollow fibers of diameter comparable to that of human hair (42 µm internal diameter, 85 µm external diameter). The hollow fibers are assembled in bundles and folded in a half to a length of approximately 48 in. (1200 mm).
The hollow-fiber bundle is 4 to 8 in. (101.6 to 203.2 mm) in diameter and is located inside a cylindrical housing that is 6 to 12 in. (152.4 to 307.2 mm) across and 54 in. (1370 mm) long. Both ends of the bundle are epoxy-sealed to encapsulate the water introduced in the tube in a way that allows all of the concentrate generated in the tube to exit from only one location-the back end of the membrane ( FIG. 14).
The feed water is introduced in the bundle (membrane element) through a plastic perforated tube (feed water distributor) that extends over the entire length of the membrane and is located in the center of the bundle. The feed water flows radially and permeates through the thin membrane film of the hollow fibers; the salts and impurities contained in this water are collected on the outer side of the fibers and evacuated through the concentrate pipe at the back end of the membrane element. Permeate is collected in the inner tubes of the hollow fibers and conveyed to the product water connection, which is located on the back or feed end of the membrane element.
As compared to spiral-wound membrane configuration, hollow-fiber membrane configuration allows approximately 4 times more membrane surface per cubic foot of membrane volume. This higher surface area results in a proportionally lower permeate flux for the same volume of processed water, which in turns reduces concentration polarization and associated scaling potential when the source seawater is of high mineral content.
As a result, a typical hollow-fiber vessel contains only two membrane elements but produces approximately the same volume of water as a conventional RO vessel that contains seven or eight elements. These features make hollow-fiber membrane elements very suitable for high-salinity waters with elevated scaling potential, such as those of the Persian Gulf, the Gulf of Oman ( Indian Ocean), and the Red Sea. Therefore, this type of membrane element configuration has found a wider application in the Middle East than in other parts of the world.
Because of the lower permeate flux and higher membrane surface area, the feed water flow regime in a hollow-fiber membrane element is laminar (as compared to nearly turbulent flow that occurs in the spiral-wound elements). This low-energy laminar flow results in little to no "scrubbing effect" of the feed flow on the surface of the membranes. This low velocity along the membrane surface allows solids and bio film to attach to and accumulate more easily on the membranes, which in turn makes hollow-fiber membranes more susceptible to particulate fouling and biofouling and more difficult to clean. As a result, this type of element requires more enhanced source water pretreatment to remove particulate foulants from the water and it operates better on waters of low turbidity and SDI, such as those obtained from well intakes. For comparison, the turbulent flow on the surface of a spiral-wound membrane element makes that membrane configuration more resistant to particulate fouling and biofouling, but because of the higher permeate flux and concentration polarization, it is more prone to mineral scaling. Currently, the only large company that makes hollow-fiber membrane elements is Toyobo Company, Japan. Their membranes are made of cellulose triacetate.
3.3 Flat-Sheet RO Membrane Elements
Flat-sheet membrane elements are used in plate-and-frame RO systems ( FIG. 15). In this case, the elements consist of flat membrane sheets similar to those that are rolled to create spiral-wound elements. Typically, two flat-sheet membranes are placed in filtration plates with the membrane film site outward so that they form an envelope. The filtration plates are integral parts of the RO system stacked within its frame structure.
Permeate spacers are installed between each pair of membrane sheets, forming an envelope to facilitate permeate collection and prevent the membrane sheets from sticking to each other. Feed water/brine spacers are installed between the membrane envelopes to allow feed water to flow through.
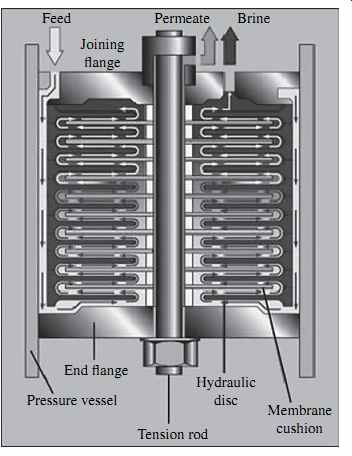
FIG. 15 Plate-and-frame RO unit.
Because of its low membrane packing density--which is approximately half that of a spiral-wound system--this type of RO system is significantly larger and more costly than a conventional spiral-wound RO system. Therefore, plate-and-frame systems have not found application for municipal water RO desalination. However, under the plate-and-frame configuration, the flat membrane sheets can easily be removed from the module and can individually be hand-cleaned. This allows for better cleaning and facilitates the use of this type of system for high-solids applications such as food processing.
4. Reverse Osmosis System-General Description
This section describes basic configuration and performance parameters of RO systems using spiral-wound membrane elements.
4.1 Configuration
As indicated in the previous sections, RO membranes in full-scale installations are assembled in membrane elements (modules) installed in vessels in series of six to eight elements per vessel, and the feed water is introduced to the front membrane elements and applied tangentially on the surface of the membranes in a cross-flow direction at pressure adequate to overcome the osmotic pressure of the saline water and the energy losses associated with the separation process. A general schematic of an RO system is shown in FIG. 16. Key parameters associated with the performance of reverse osmosis systems are discussed in the following subsections.
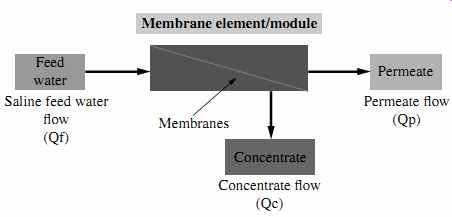
FIG. 16 General schematic of an RO system.
4.2 Reverse Osmosis Process Parameters
Osmotic Pressure
The osmotic pressure Po of a given saline water is calculated by measuring the molar concentrations of the individual dissolved salts in the solution and applying the following equation:
O R T m p I = × + × ? ( ) 273 (eqn.1)
where Op = the osmotic pressure of the saline water (in bars-1 bar = 14.5 lb/in2 )
R = the universal gas constant [0.082 (L·atm)/(mol·K) = 0.0809 (L·bar)/(mol·K)]
T = the water temperature in degrees Celsius, and ?mi is the sum of the molar concentrations of all constituents in the saline water.
This formula is derived from Van't Hoff's thermodynamic law, which is applied to pressure caused by dissociation of ions in solution.
As an example, let us calculate the osmotic pressure of Pacific Ocean seawater with a TDS concentration of 35,000 mg/L (see Table 1). Table 1 shows the estimate of the molar concentration of all salts in the source Pacific Ocean seawater (? mi ). Based on Eqn. 1, the osmotic pressure of the Pacific Ocean seawater at 25ºC is calculated as:
Po = 0.0809 × (25 + 273) × 1.1135 = 26.8 bar (388.6 lb/in2 )
The relative osmotic pressure per 1000 mg/L of TDS of Pacific Ocean water is 26.8/(35,000/1000) = 0.77 bar (11 lb/in2 ). This ratio is often used as a rule-of-thumb relationship between source water salinity and osmotic pressure, i.e., every 1000 mg/L of salinity results in an osmotic pressure of 0.77 bar (11 lb/in2 ).
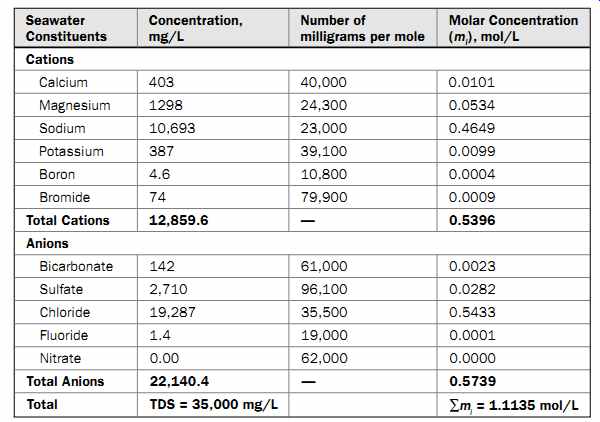
Table 1 Molar Concentrations of Pacific Ocean Water Salts
Depending on the source water quality and temperature, the osmotic pressure may vary significantly from one saline source water to another. For example, in the case of the brackish water from the source in Tularosa, New Mexico, presented in Table 3- where calcium sulfate contributes over 70% of the TDS concentration and sodium chloride is only 11%-the actual osmotic pressure of the source water will be significantly lower than the one estimated using the rule of thumb. If the calculations shown in Table 1 are completed for the brackish water from Tularosa, New Mexico, shown in Table 3, the osmotic pressure of this water will be only 1.12 bar (16 lb/in2 ), while the rule of thumb would result in an osmotic pressure estimate of 0.77 × (2542/1000) = 1.96 bar (28 lb/in2 ), which is 75% higher than the actual value. This calculation underlines the facts that osmotic pressure is a parameter that should be calculated individually for the specific source water quality and that rules of thumb for this parameter may often over- or underestimate its actual value.
Permeate Recovery
Due to mineral scaling, concentration polarization, and standard equipment and facility constraints, only a portion of the saline source water flow fed to the RO membrane system can be converted into freshwater (permeate). The percentage of the feed source water flow Qf that is converted into freshwater flow Qp is defined as the permeate recovery rate Pr ( FIG. 17):
Pr = (Qp/Qf ) × 100% (eqn.2)
As indicated in FIG. 17, for typical seawater reverse osmosis (SWRO) systems the recovery rate is 40 to 65%. Brackish water desalination plants are designed and operated at higher recoveries (typically 65 to 85%).
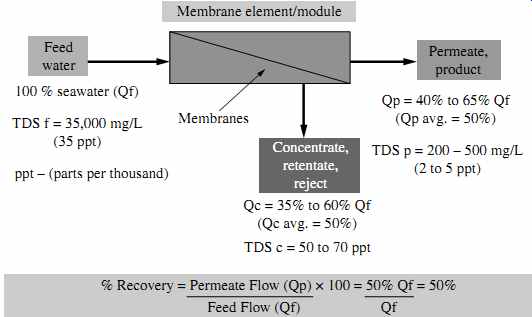
FIG. 17 Recovery of a typical SWRO system.
The TDS of the concentrate TDSc can be calculated based on the RO system permeate recovery rate Pr, , the actual TDS concentration of the permeate TDSp, and the feed water TDS (TDSf ) using the following formula:
For the example in FIG. 17, the TDS of the concentrate-assuming a recovery rate of 50% and a permeate salinity of 200 mg/L-is calculated as follows:
As can be seen from Eqn. 3, the higher the RO system permeate recovery rate, the more freshwater is produced from the same volume of saline source water. For example, a brackish water system designed at 75% recovery will produce 75 m3 of low-salinity water (permeate) and 25 m3 of concentrate out of every 100 m3 of brackish water.
Since practically all dissolved solids contained in the source water will be retained in one-fourth the volume (100/25 = 4), the RO system concentrates the source water by a factor of 4 (400%). This factor is of critical importance in terms of the ability of various salts and other compounds, such as silica, to form crystal scale on the surface of the membranes. As indicated in Table 6, at a concentration factor of 4 (400%), calcium sulfate scale is likely to form (as are other scales). Knowing the concentration factor of the RO system is also important for making decisions regarding the most suitable type of concentrate management system. It should be pointed out that plant recovery rate (and the associated concentration factor) also has an impact on product water quality.
The more water passes through the membranes, the more salts pass as well; therefore, the overall permeate water quality decreases with an increase in system recovery. The passing of salts through the membrane can be controlled to some extent by the membrane structure, i.e., membranes with tighter structure will pass fewer salt ions when the RO system is operated at higher recovery.
Membrane Salt Passage
Salt passage Sp of a membrane is defined as the ratio between the concentration of salt in the permeate TDSp and in the saline feed water TDSf (see FIG. 17); it is indicative of the amount of salts that remain in the RO permeate after desalination.
Sp = (TDSp/TDSf ) × 100% (eqn. 4)
Membrane Salt Rejection Salt rejection Sr
is a relative measure of how much of the salt that was initially in the source water is retained and rejected by the RO membrane:
Sr = 100% - Sp = [1 - (TDSp/TDSf )] × 100% (eqn. 5)
For the seawater desalination example depicted in FIG. 17, the salt passage of the SWRO membrane for the high end of performance (TDSp = 200 mg/L) is Sp = (200/35,000) × 100% = 0.57%. The total salt rejection of this membrane is Sr = 100% -0.57% = 99.43%.
It should be pointed out that salt passage and rejection can be applied not only to the total dissolved solids contained in the source water as a whole but also to individual ions contained in the water. Not all ions are rejected equally by an RO membrane. Usually, the larger the ions and the higher their electrical charge, the better rejected they are.
This means, for example, that bivalent ions such as calcium and magnesium will be rejected better than monovalent ions such as sodium and chloride.
It is also important to note that RO membranes do not reject gases. So if the source water contains ammonia and hydrogen sulfide, which are gases commonly encountered in brackish water, these gases will remain in the permeate and will be at elevated concentration as compared to their content in the source water. RO membranes also do not reject free chlorine gas, carbon dioxide, or oxygen. Ammonia and carbon dioxide gases can be rejected if they are converted into ammonium ion and bicarbonate ion by pH adjustment.
Also, low-charge monovalent ions such as boron will be rejected at a lower rate than higher-charge monovalent ions such as chloride and sodium. This is a very important feature of RO membranes, because-often for practical purposes-RO membrane structure can be modified to selectively reject specific ions better.
For example, the RO membrane material can be modified to have a "looser" structure and remove mainly bivalent ions when the key goal of water treatment is water softening (i.e., removal of calcium and magnesium). Such reverse osmosis membranes are often referred to as nanofiltration membranes. Nanofiltration membranes usually reject less than 30% of TDS (as compared to RO membranes, which reject over 90% of TDS), but they reject over 99% of calcium and magnesium and they do that at higher productivity and lower feed pressure.
Because the weight and valence of the rejected ions are very important factors influencing RO membrane salt passage and rejection, and since the source water's ion makeup can vary significantly from one location to another, sodium chloride and sodium sulfate are typically used as "standard" salts against which the rejection of different commercial RO membranes is measured.
Membrane rejection is tested against a standard salt feed solution of predetermined salinity; testing is performed at standard test feed pressure and feed flow rate.
For example, for most commercial SWRO membranes, salt rejection is determined using a standard test solution of sodium chloride at a salinity concentration of 32,000 mg/L, test feed pressure of 55.2 bar (800 lb/in2 ), and test recovery rate of 10%. Salt rejection for most commercially available SWRO membranes at these test conditions is 99.60 to 99.85%.
Brackish water elements are typically tested using a standard sodium chloride solution with a TDS of 500 to 2000 mg/L, test pressure of 6.7 to 15.5 bar (100 to 225 lb/in2 ), and recovery rate of 15%. Standard salt rejection of most brackish RO elements varies between 99.0 and 99.6%. It should be noted that when used to desalinate actual saline water, commercially available RO membrane elements usually have a lower overall TDS rejection (higher salt passage) than their standard level reported in manufacturer specifications-mainly because not all ions contained in the saline source water are rejected as well as sodium and chloride. In addition, the actual feed rate and recovery of the RO system impact membrane rejection. Performance parameters of commercially available membranes commonly used for brackish and seawater desalination are presented in greater detail in section 14.
Net Driving Pressure (Trans-membrane Pressure)
Net driving pressure (NDP), also known as trans-membrane pressure, is the actual pressure that drives the transport of freshwater from the feed side to the freshwater side of the membrane. The average NDP of a membrane system is defined as the difference between the applied feed pressure Fp of the saline water to the membrane and all other forces that counter the movement of permeate through the membrane, including the average osmotic pressure Op which occurs on the permeate side of the RO membrane, the permeate pressure Pp existing the RO pressure vessel, and the pressure drop Pd across the feed/concentrate side of the RO membrane. The NDP can be calculated as follows:
The applied feed pressure Fp is controlled by the RO system operator and delivered through high-pressure feed pumps. The average osmotic pressure Op of the membrane is determined by the salinity and the temperature of the source water and the concentrate.
The permeate pressure Pp (also known as product water back pressure) is a variable that is controlled by the RO plant operator and is mainly dependent on the energy needed to convey permeate to the downstream treatment and/or delivery facilities.
Typically, permeate pressure is set at 1 to 2 bar (15 to 30 lb/in2 ). The osmotic pressure of permeate is usually very small, because the salinity of this stream is low. Therefore, for practical purposes it is typically omitted from the calculations of the NDP.
The pressure drop Pd across the feed/concentrate side of the RO membrane depends mainly on the membrane fouling and the RO membrane and system configuration. This pressure drop is usually between 1.0 and 3.5 bar (14.5 and 50.7 lb/in2 ).
For the example in FIG. 17, assuming an SWRO system recovery of 50%, saline water feed pressure of Fp = 56 bar (812 lb/in2 ), permeate pressure Pp = 1.4 bar (20.3 lb/in2 ), and pressure drop across the RO system Pd = 3.2 bar (46.4 lb/in2), the NDP at which the system operates is determined as follows:
1. Calculate the average salinity on the feed/concentrate side of the RO membrane.
2. Calculate the average osmotic pressure of the saline water on the feed/ concentrate side.
Membrane Permeate Flux
Membrane permeate flux ( J), also referred to as membrane flux, is defined as the permeate flow a membrane produces per unit membrane area. It is calculated by dividing the flow rate Qp of permeate produced by a RO membrane element [usually expressed in gallons per day (gpd) or liters per hour (lph)] by the total membrane area S of the element (in square feet or square meters). The flux unit is therefore gal/(ft 2·day), also referred to as gfd, or L/( m2·h), also known as lmh.
Since a full-scale RO system consists of a number of membrane elements, the aver age permeate flux of the system is calculated by dividing the total flow of permeate produced by all membranes by the total surface area of the membranes.
For design purposes, flux is selected as a function of the source water quality and the type of RO membrane used for desalination. The higher the quality of the source water applied to the membranes, the higher the acceptable design flux. This is the reason why the use of well water or water pretreatment with ultrafiltration or microfiltration membranes that produce water with SDI below 3 can often be designed and operated at higher fluxes.
Conversely, if the source water has a higher solids content (SDI > 4 most of the time), then operating the RO system at a higher flux would result in an unreasonably high frequency of cleaning, because of the rapid rate of accumulation of solids on the membranes and reduction of their permeability.
The higher the permeability of a given membrane (i.e., its ability to transport water), the higher the maximum flux the membrane can be designed for at the same source water quality. For example, brackish water RO membranes have a looser (i.e., more permeable) molecular structure; therefore, when they process high-quality well water (SDI < 2) or RO permeate, they can be operated at approximately two times higher fluxes than SWRO membranes.
Specific Membrane Permeability (Specific Flux)
Specific membrane permeability (SMP), also known as specific membrane flux, is a parameter that characterizes the resistance of the membrane to water flow. It is calculated as the membrane permeate flux ( J ) divided by the net driving pressure (NDP):
SMP = J/NDP (eqn.8)
The standard specific permeability of a given membrane is typically determined for a feed temperature of 25°C and expressed in lmh/bar or gfd/(lb/in2 ). For example, most commercially available seawater desalination RO membranes at present have an SMP of 1.0 to 1.4 lmh/bar [0.04 to 0.06 gfd/(lb/in2 )]. For comparison, brackish water RO membranes have a significantly higher specific permeability of 4.9 to 8.3 lmh/bar [0.2 to 0.35 gfd/(lb/in2 )].
Nanofiltration membranes, which have a "looser" membrane structure, have an even higher specific permeability than brackish and seawater RO membranes: 7.4 to 15.8 lmh/bar [0.3 to 0.6 gfd/(lb/in2)]. Usually, membranes of lower specific permeability also have higher salt rejection, so there is a tradeoff between lower production and higher water quality. The specific membrane permeability is determined by the chemical and physical nature of the membrane.