AMAZON multi-meters discounts AMAZON oscilloscope discounts
1. Introduction
A desalination plant's source water quality has an impact on the treatment needed and ultimately on the quality of the produced drinking water. Desalination plants can use either subsurface intakes, for collection of source water from brackish aquifers or coastal seawater aquifers, or open intakes, for collection of saline surface source water. Subsurface intakes collect saline water which is prefiltered through the surrounding geological formations; often this water is not influenced by anthropogenic contamination and does not contain pathogens. However, when the aquifer from which saline source water is taken is of alluvial origin or is influenced by an adjacent alluvial aquifer, the water may contain elevated concentrations of iron and manganese, arsenic, cyanide, ammonia, sodium bisulfite, and other undesirable compounds of natural origin.
Open intakes receive raw water directly from the water column of the surface saline source (ocean, river, lake, etc.). Therefore, this type of intake is almost always under the influence of potential natural and anthropogenic sources of contamination, such as surface runoff, commercial and recreational ship traffic, and storm water and wastewater discharges. Therefore, it may contain pathogens.
Source water characterization and assessment is a key component of the planning and design of desalination projects. The type and detection level of the measured source water pollutants are mainly determined by the applicable product water quality regulations and regulatory requirements governing the desalination plant's discharge. In addition, saline source water quality is typically analyzed for parameters that may not be regulated but do have an impact on the final use of the desalinated water and on the desalination plant's performance, such as silt density index, algal content, silica, total and biologically assimilable organic carbon, minerals that can foul the reverse osmosis (RO) membranes.
2 Watershed Sanitary Survey
In accordance with the requirements of the federal Safe Drinking Water Act in the United States, the source water quality of desalination plants with open intakes has to be determined by completing a watershed sanitary survey. This survey quantifies pollutants regulated by the Safe Drinking Water Act and state regulatory requirements, and identifies potential sources of water contamination in terms of pathogens and other anthropogenic pollutants located within a 1.64-km (1.0-mi) radius of the location of the intake.
A typical watershed sanitary survey contains descriptions and evaluation of the following:
• Source water intake-physical components, configuration, and condition
• Source water treatment approach that addresses the site-specific water quality challenges of the project
• Potential impacts of the new source of water supply on the receiving water distribution system
• Location and configuration of finished water storage facilities
• Location and configuration of product water pump facilities and controls
• Source water quality monitoring data collected at the intake area over a period of 6 to 12 months
• Proposed water distribution system modifications to accommodate the new water source
• Plan for water treatment plant operator compliance with all applicable regulatory requirements for drinking water production and distribution from the new source
Development (and subsequent five-year updates) of the watershed sanitary survey for a given desalination project with an open intake is a costly effort; completion typically takes over one year. However, the survey is required by the current regulations to document potential changes in source water quality and new sources of contamination in the source water intake area.
For desalination plants using subsurface intakes that are not under the influence of surface water contamination (i.e., confined brackish water aquifers), current Safe Drinking Water Act regulations allow the desalination project's proponent to complete a more simplified characterization of the source water quality, referred to as a source water assessment. However, a practical challenge that many desalination projects with subsurface intakes face is how to determine that the collected source water is not under the influence of surface water contamination. Current regulations do not specify a clear path for such a determination, nor the types of studies and water quality collection efforts needed to adequately complete such a determination. If deep confined brackish water aquifers are used to collect source water for a given desalination project, the determination is relatively easier. However, if the desalination plant is equipped with subsurface intake such as vertical beach wells, infiltration galleries, and horizontal and slant wells that collect water from an unconfined shallow aquifer, at present there is no clearly defined methodology or criteria for determining whether the subsurface intake is under the influence of surface water contamination. This issue is further complicated by the fact that beach erosion and storm impacts can result in a change of the depth of the filtration layer separating the subsurface intake well screens from the surface water over the useful life of the desalination project.
3 Assessment of the Pathogen Content of Source Water
Key pathogens of concern for human health that may be contained in the source water used for desalination are viruses, Giardia cysts, and Cryptosporidium. Removal and inactivation requirements for viruses and Giardia in the saline source water collected by open intakes or subsurface intakes collecting groundwater under the direct influence of surface water are established in the US Environmental Protection Agency's Surface Water Treatment Rule, while the Cryptosporidium log removal requirements are addressed in the agency's Long Term 2 Enhanced Surface Water Treatment Rule.
Most human pathogens are of freshwater origin; they are less likely to survive in seawater or in highly saline brackish water. However, at present there are no comprehensive studies that allow the establishment of a clear correlation between the survival rates of viruses, Escherichia coli, Giardia cysts, and Cryptosporidium oocysts and source water salinity. Therefore, source water characterization in terms of pathogens has to be completed for each individual desalination project for a period of 12 to 24 months. During this testing period, grab samples have to be collected at least once per month at the same intake location and time of day. These samples, at a minimum, have to be analyzed for Cryptosporidium, Giardia, total and fecal coliform count, total heterotrophic plant count, and turbidity.
4 Overview of Source Water Constituents
The constituents contained in source water used for desalination can be classified in four main groups: (1) dissolved minerals and gases, (2) colloids and suspended solids, (3) organics, and (4) microorganisms. During membrane separation, all of these constituents either are removed by the membranes, pass through the membranes into the low-salinity water stream, or are retained and accumulate on the surface and in the molecular matrix of the membranes.
The source water constituents retained and accumulated on the membrane surface or in the molecular membrane structure over time change the membranes' ability to reject new constituents and to produce freshwater of desired quantity and quality. Such constituents are referred as foulants and are of particular importance in the design and engineering of desalination systems.
Depending on their nature, membrane foulants can be classified as follows:
• Particulate foulants (mainly suspended solids and silt)
• Colloidal foulants-compounds of relatively small size (0.2 to 1.0 µm) that are not in fully dissolved form, which when concentrated during the membrane separation process may coalesce and precipitate on the membrane surface (mainly claylike substances)
• Mineral scaling foulants-inorganic compounds (i.e., calcium, magnesium, barium, and strontium salts) which during the salt separation process may precipitate and form a scale on the membrane surface (such as calcium carbonate and sulfate or magnesium hydroxide) or may block the membrane diffusion layer (such as iron and manganese)
• Organic foulants-organic matter of natural or anthropogenic origin that can attach to and foul membranes
• Microbial foulants-aquatic organisms and soluble organic compounds that can serve as food to the microorganisms which inhabit the source water and can form a fouling biofilm that reduces membrane transport
5 Minerals
The primary purpose of desalination is to remove dissolved minerals (salts) contained in the saline source water. A commonly used measure of the content of dissolved minerals is the concentration of total dissolved solids (salinity). This parameter encompasses all ions in the source water, including sodium, potassium, bromide, boron, calcium, magnesium, chloride, sulfate, bicarbonate, nitrate, metals, etc.
5.1 Mineral Content of Seawater Table 1 Typical Pacific Ocean Water Quality
Table 1 shows key ion content and total dissolved solids (TDS) concentrations of typical Pacific Ocean water and of permeate produced from this water by seawater reverse osmosis (SWRO) membrane separation. Concentrations in this table are expressed both in milli grams per liter (mg/L) and in milliequivalents per liter (meq/L).
The milligrams-per-liter parameter indicates the ratio of ion weight to solution volume.
The milliequivalent-per-liter designation reflects the capacity of ions to react with one another. The atomic or formula weight of an ion divided by its valence (number of positive or negative charges) is called the equivalent weight (eq) of the ion. One-thousandth of this weight is termed a milliequivalent (meq). For example the milliequivalent-per-liter concentration of calcium in Table 1 can be calculated as follows:
1. Calcium has a molecular weight of 40.08 g/mol.
2. Calcium has a valence of +2.
3. The equivalent weight of calcium is (40.08 g/mol)/(2 eq/mol) = 20.04 g/eq (or mg/meq).
4. Since the seawater sample in Table 1 contains 403 mg/L of calcium, then the concentration of calcium in milliequivalents per liter is (403 mg/L of calcium)/ (20.04 mg/meq) = 20.1 meq/L of calcium.
The main reason why the TDS concentration is often measured in milliequivalents per liter instead of in milligrams per liter is to check the accuracy of the measurement for the water for which analysis is completed. When added together, the milliequivalent-per-liter concentrations of cations (positively charged ions) contained in the water should approximately equal the total milliequivalent-per-liter concentrations of anions (negatively charged ions) in the solution. These two values are usually not exactly equal, since other ions beside those listed in Table 1 are present in the water. If the difference between total cation and anion content exceeds 5 to 10 percent, then the accuracy of the laboratory analysis is inadequate or other ions are present in the water which may not have been reported or which are not typically contained in saline water of the particular type of source.
Analysis of Table 1 indicates that sodium chloride contributes over 85 percent of the TDS concentration of Pacific Ocean water. The three other large contributors to TDS are sulfate (8 percent), magnesium (4 percent), and calcium (1 percent). All other ions in seawater combined contribute only 2 percent of the TDS in the water.
The ion makeup of seawater at the same location may vary seasonally, typically within a range of 10 percent. However, seawater salinity varies in a much wider range in different parts of the world. Table 2 shows the typical salinity and temperature of sea water in various arid areas throughout the world; the highest-salinity seawater occurs in the Middle East (the Persian Gulf and Red Sea). The table also contains the typical values of another key source water quality factor for RO desalination-temperature. Warmer water has lower viscosity (i.e., is less dense), which in turn increases the production rate of the RO membranes, and vice versa.
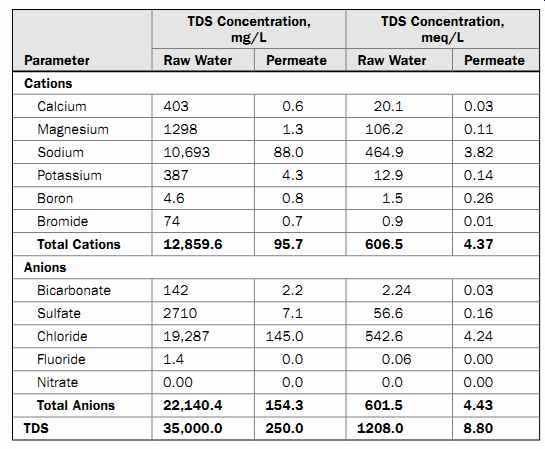
Table 1
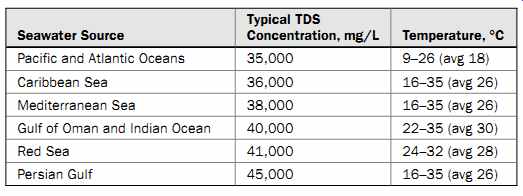
Table 2 Seawater TDS and Temperature of Various Ocean Water Sources
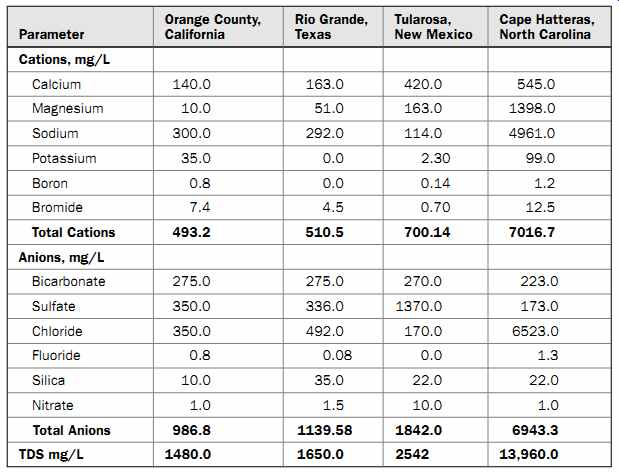
Table 3 Brackish Water Quality of Several Sources
5.2 Mineral Content of Brackish Water
Table 3 presents the TDS content of several brackish water sources located in the United States. Analysis of this table indicates that brackish water TDS content may vary significantly from one location to another and that sodium and chloride may not always be the main contributors to the TDS content of the water. Usually, brackish water has a higher content of silica and nitrates than does seawater, which often necessitates additional pretreatment.
Because the existing standard method for measurement of TDS concentration of water involves collection and evaporation of a discrete water sample at 105°C followed by weighing of the solids remaining after evaporation, this parameter can only be measured discretely. On the other hand, the continuous monitoring of source water and product water TDS concentrations is essential for the cost-effective and efficient operation of RO systems.
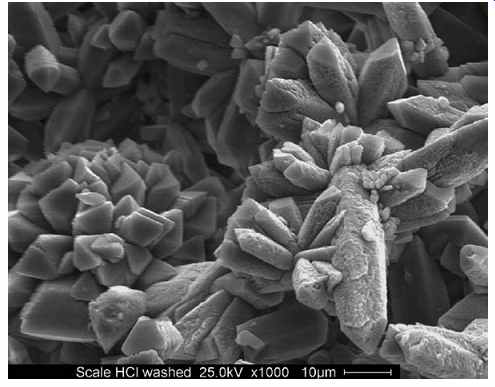
FIG. 1 Crystalline scale on the surface of an RO membrane.
Therefore, in practice, TDS concentration is often monitored continuously by measurement of the electrical conductivity (EC) of the water. Electrical conductivity (also known as specific conductance) is a measure of a solution's ability to conduct electricity.
Conductivity is expressed in microsiemens per meter (µS/m).
The ratio between TDS and EC in source water is site specific and usually varies in a range between 0.67 and 0.70. For example, seawater with a TDS concentration of 35,000 mg/L would typically have a conductivity of 50,000 to 52,000 µS/m. The ratio between TDS and EC depends on the content of sodium chloride in the water and on the temperature. If the TDS is made of 100 percent sodium chloride, the TDS/EC ratio is typically 0.5. This ratio increases as the content of sodium chloride decreases (i.e., ions other than sodium and chloride have a measurable contribution to salinity). Since product water TDS consists of over 91 percent sodium chloride (as compared to source seawater, where sodium chloride contributes only 86 percent of the salinity), the typical ratio of TDS to EC in permeate is 0.5.
The TDS of the source water is the most important water quality parameter in RO desalination for two main reasons. This parameter is a main factor in determining the feed pressure and therefore, the energy needed to produce freshwater from a given saline water source. Every 100 mg/L of TDS in the source water creates approximately 0.07 bar (1 lb/in2 ) of osmotic pressure, which will need to be overcome by the pressure applied to the saline water fed to the RO membranes. For example, seawater that contains 35,000 mg/L of TDS will create approximately 24.5 bar (355 lb/in2 ) of osmotic pressure. In addition, TDS concentration of the source water is a key factor in determining the expected product water quality, since RO membranes reject a given percentage of the feed water's TDS.
Besides sodium and chloride, which need to be removed in order to produce freshwater, other key inorganic constituents of TDS are various minerals (mainly salts of calcium and magnesium). These bivalent salts can precipitate on the surface of the membrane and form a thin layer of crystalline scale ( FIG. 1), which in turn can plug the membrane surface and significantly reduce membrane productivity.
6 Dissolved Gases
Both seawater and brackish water often contain various dissolved gases. The most common gases are oxygen, carbon dioxide, hydrogen sulfide, and ammonia. All of these gases pass through RO membranes, and thus desalination is typically not a suitable technology for degasification of brackish and seawater for drinking water production. Usually, ocean water and desalinated water originating from it are supersaturated with dissolved oxygen. The dissolved oxygen concentration of these waters typically varies between 5 and 8 mg/L. For comparison, most brackish waters originating from groundwater aquifers have a very low oxygen content (0.5 mg/L or less). Because of its high oxygen content, seawater does not contain hydrogen sulfide. This gas is, however, frequently encountered in source waters from brackish aquifers.
7 Particulate Membrane Foulants
7.1 Description
Particulate foulants are organic and inorganic particles contained in the source water, such as fine debris, plankton, detritus, and silt. These solids cannot pass through RO membranes. All suspended solids which naturally occur in insoluble form, if not removed by pretreatment, would be retained on the feed side of the RO membranes; depending on the hydrodynamic conditions on the membrane surface and the size and charge of these particles, they would either migrate along the membrane leafs and ultimately exit with the concentrate or will be trapped on the membrane surface and begin to accumulate there, causing loss of membrane productivity over time. This type of foulant can be effectively removed by pre-filtering of the source water prior to RO membrane separation.
Particulate foulants in raw source seawater vary in size. However, most of them, including picophytoplankton, are larger than 0.1 µm. Usually over 90 percent of particulate foulants are larger than 1 µm. A well-designed and properly operating pretreatment system will produce permeate that does not contain particles larger than 20 µm.
Typically, suspended solids larger than 100 µm contained in seawater and surface brackish water are settleable and can be removed by clarification of the source water prior to filtration.
7.2 Parameters and Measurement Methods Turbidity
Turbidity is a parameter which measures the content of particulate foulants in the source seawater. The turbidity level in the source water is indicative of the content of clay, silt, suspended organic matter, and microscopic aquatic life, such as phyto- and zooplankton. It is expressed in nephelometric turbidity units (NTU).
The turbidity of open ocean and surface brackish waters can vary between 0.1 and several hundred NTU, although under normal dry weather conditions, it is typically between 0.5 and 2.0 NTU. Rain events, algal blooms, storms, snowmelt, river discharges, and human activity (such as wastewater discharges, ship traffic, etc.) can cause significant turbidity increases and variations. Usually, saline water with a turbidity below 0.05 NTU causes very low particulate fouling. Most RO membrane manufacturers have a maximum feed water turbidity of 1.0 NTU, although this level is relatively high in practical terms. Usually, filtered water turbidity below 0.1 NTU is desirable.
Although turbidity is a good measure of the overall content of particulates in the source water, on its own it is not an adequate parameter to characterize water's potential for particulate or other fouling. Turbidity measurement does not provide information regarding the type and size of particles in the source water and does not measure the content of dissolved organic and inorganic foulants. The size of particles contained in the source water matters because RO membrane feed and concentrate spacers, through which the saline source water is distributed inside the membranes, are of limited width (typically 0.7 to 0.9 mm).
Silt Density Index
Silt density index (SDI) is a parameter that provides an indication of the particulate fouling potential of source water. If RO system is operated at a constant transmembrane pressure, particulate membrane fouling will result in a decline of system productivity (membrane flux) over time. SDI gives an indication of the rate of flux decline through a filter of standard size and diameter operated at constant pressure for a given period of time.
A standard SDI15
test procedure is described in ASTM Standard D4189-07 (American Water Works Association, 2007) and is based on the measurement of the time in seconds it takes to collect a 500-mL sample through a paper filter of size 0.45 µm and diameter 45 mm both at the start of the test (t 0 = 0 min) and after the source water has flowed through the filter under a driving filtration pressure of 2.1 bar (30 lb/in2 ) for 15 min (t 15 = 15 min). The two sample durations (t 0 and t 15 ) are applied to a formula (Eq. 2.1), and the resulting SDI15 value indicates the particulate fouling potential of the source water:
SDI15 1 100 = - ( ) t t n 0 n (eqn 1)
where t0 and tn = the respective times in seconds it takes to collect 500 mL of filtered water at the beginning of the test and after running water through the filter for the duration of the selected test run time.
It should be pointed out that while the standard SDI test requires a test run time of 15 min between the first and second measurements, the test can also be run for 5 or 10 min, depending on the solids concentration. Based on this formula, the maximum value of SDI15 is 6.7; this condition would occur if the time to collect 500 mL after 15 min of filtration were infinite.
Typically, source water with an SDI15 lower than 4 is considered to have adequately low RO membrane particulate fouling potential, and its use in membrane desalination is expected to result in a reasonably slow flux decline over time. Source water with SDI15 lower than 2 is considered to have a very low fouling potential and to be of good quality.
In order to maintain their performance warranties, membrane manufacturers usually require that the SDI of the source water fed to the RO membranes be less than 5. If a source water's SDI15
is higher than 5, this typically means that this source water has a very high content of particulate foulants and therefore is not directly suitable for desalination, because it would likely cause accelerated fouling of RO membranes. For source water with such a high SDI15 value, it is often useful to complete the SDI test at shorter (5- or 10-min) intervals, which will usually provide more meaningful results.
FIG. 2 shows filtration pads from SDI15 tests along with the SDI15 values of pre treated seawater. The SDI test pads marked "D2" are from iron-salt coagulated seawater pretreated via two-stage upflow sand media filters, while these marked "Zenon" are from noncoagulated ultrafiltration (UF) filter effluent.
The top two D2 SDI filter pads (5.3 SDI and 5.2 SDI) have a brown discoloration caused by an overdose of ferric coagulant. These SDI tests indicate that the pretreated influent is not suitable for SWRO treatment, due to high SDI levels. The other SDI pads are indicative of pretreated filter effluent of relatively low particulate fouling potential.
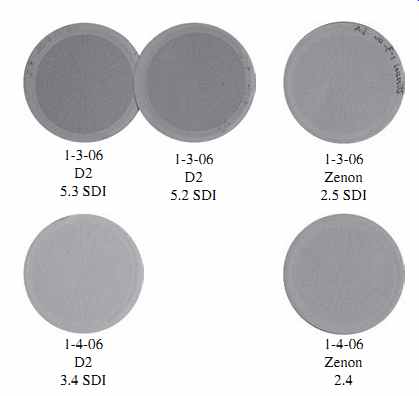
FIG. 2 SDI pads from tests of pretreated seawater of various quality.
It should be pointed out that although widely used in operation practice today, the SDI15 test has only a limited ability to measure the RO membrane fouling potential of saline water. The test is based on filtration of a saline water sample through a microfiltration (MF) membrane pad with 0.45-µm pore openings. Therefore, the SDI measurement is mainly indicative of the content of large-size particulates and colloids in the source water. The mechanisms of fouling for permeable MF and UF membranes and semipermeable RO membranes may differ significantly, depending on the types of foulant contained in the source water.
Fouling of MF and UF membranes usually occurs due to a combination of micro pore plugging and cake formation on the membrane surface. In contrast, RO membranes are typically fouled by the formation of cake of deposits on the membrane surface (without pore plugging). Since smaller particles create significantly higher resistance in the filter cake than big particulates, their effect on RO membrane fouling can be much more pronounced than that of the large-size particles captured by the SDI test.
In order to address the effect of smaller particles on SWRO membrane fouling, a number of alternative filtration indices have been developed over the past 10 years.
Advantages and disadvantages of these modified fouling indices are discussed elsewhere.
Total Suspended Solids
Total suspended solids (TSS) concentration is a measure of the total weight of solid residuals contained in the source water; and it is customarily presented in milligrams per liter. TSS is measured by filtering a known volume of water (typically 1 L) through a preweighed glass-fiber filter, drying the filter with the solids retained on it at 103 to 105°C, and then weighing the filter again after drying. The difference between the weight of the dried filter and of the clean filter, divided by the volume of the filtered sample, reflects the total amount of particulate (suspended) solids in the source water.
It should be pointed out that because saline water contains dissolved solids which will crystallize and convert into particulate solids when the sample is heated at 103 to 105°C, often TSS analysis of saline water completed in accordance with the standard methods for water and wastewater analysis yields an erroneously high TSS content in the water. The higher the source water's salinity and the lower its particulate content, the more inaccurate this measurement is. In order to address the challenge associated with the standard method of TSS measurement, it is recommended to wash the solids retained on the filter by spraying the filter with deionized water before drying. Unless the source water solids sample is washed before drying, the results of this sample are meaningless.
If the laboratory TSS test is completed properly and the filtered sample is well washed, this parameter usually provides a much more accurate measure of the actual content of particulate solids in the source water than does turbidity, because it accounts for the actual weight of the particulate material present in the sample. For comparison, turbidity measurement is dependent on particle size, shape, and color, and typically is not reflective of particles of very small size (i.e., particles of 0.5 µm or less), such as fine silt and picoalgae.
In fact, a change in the ratio of TSS to turbidity is a good indicator of a shift in the size of particles contained in the source water, which may be triggered by algal blooms, storms, strong winds, and other similar events which can result in resuspension of solids from the bottom sediments into the water column.
Typically, an increase in the TSS/turbidity ratio is indicative of a shift of particulate solids toward smaller-size particles. For example, during non-algal-bloom conditions, the TSS/turbidity ratio of an appropriately processed sample is typically in the range of 1.5 to 2.5--i.e., water with a turbidity of 2 NTU would have a TSS concentration of 3 to 5 mg/L. During heavy algal blooms dominated by small-size (pico- and micro-) algae, the TSS of the source water could increase over 10 times (e.g., to 40 mg/L), while the source water turbidity could be multiplied by 2 to 3 times only-for this example it would be in a range of 4 to 6 NTU, with a corresponding increase in the TSS/NTU ratio from 2/1 to between 6/1 and 10/1.
Chlorophyll a
The chlorophyll a concentration of a source water is an indicator of the content of algae with green pigmentation in the water. This parameter is measured using a fluorometer or spectrophotometer. The content of chlorophyll a is proportional to the light transmission through the water sample at a given wavelength, which is detected by the instrument and converted into concentration units, typically either micrograms per liter or milligrams per liter.
As a rule of thumb, source waters with chlorophyll a content below 0.5 µg/L have low fouling potential, and algae levels are indicative of non-algal-bloom conditions.
During severe algal blooms, the chlorophyll a level could exceed 10 µg/L.
It should be pointed out that content of algae and chlorophyll a naturally varies diurnally and seasonally, and also changes with depth. In general, algal content is proportional to the intensity of solar irradiation and typically increases significantly in the summer, as compared to the average annual algal content.
Tracking chlorophyll a on a daily basis and trending the collected data allows an operator to determine the occurrence of algal bloom events, because during algal blooms, the chlorophyll a content in the source water typically increases several times in a matter of only several days.
Algal Count
Algal count is a measure of the number of algal particles per unit volume of source water. The algal count is expressed in total number of algal cells per milliliter of water.
Under normal non-algal-bloom conditions, the algal count in saline source water is usually below 1000 cells per milliliter. Algal blooms are considered to be of concern when the algal count exceeds 2000 cells per milliliter. Algal blooms are often referred as mild if the algal content is between 2000 and 20,000 cells per milliliter, of medium intensity when the algal count varies between 20,000 and 60,000 cells per milliliter, and severe when algal content exceeds 60,000 cells per milliliter.
Total algal count can be measured by online instrumentation. The algal count of individual species in the water is completed by laboratory analysis and is a very useful tool to verify the presence of algal bloom and determine the size and type of algae triggering the bloom. Typically, algal bloom is defined as an event in which over 75 percent of the algae are from the same species. Knowing the type and size of the dominant algal species is critical to optimizing the source water chemical conditioning and pretreatment approach.
Particle Distribution Profile
The particle distribution profile presents the number of solid particles in the source water for different particle size ranges. Usually particles are classified in the following ranges: 1 µm or less; > 1 and = 2 µm; > 2 and = 5 µm; > 5 and = 10 µm; > 10 and = 20 µm; > 20 and = 50 µm; and > 50 µm. Particles of sizes smaller than 1 µm are poorly removed by conventional granular media filtration and dissolved air flotation clarification; key pathogens such as Giardia and Cryptosporidium are in the range of 2 to 10 µm and are typically removed at 2 log by conventional granular media pretreatment filtration.
Particles which have a size of 20 µm or more are well removed by both membrane and granular media pretreatment filters. Typically, a pretreatment system is considered to perform well if the pretreated water contains less than 100 particles per milliliter equal to or smaller than 2 µm and does not contain larger-size particles.
7.3 Threshold Levels of Particulate Foulants
Table 4 presents a list of source water quality parameters used for characterizing particulate content that operators are recommended to measure when deciding upon the type of pretreatment needed for a given source water. Table 3 (section 13) provides general guidelines for selecting the type of pretreatment needed for the site specific conditions of a desalination project.
========
Source Water Quality
Parameter Pretreatment Issues and Considerations Turbidity, NTU Levels above 0.1 mg/L are indicative of a high potential for fouling. Spikes above 50 NTU for more than 1 h would require sedimentation or dissolved air flotation treatment prior to filtration.
Silt density index (SDI 15) Source seawater levels consistently below 2 all year round indicate that no pretreatment is needed. An SDI greater than 4 indicates that pretreatment is necessary.
Total suspended solids, mg/L Needed to assess the amount of residuals generated during pretreatment. It does not correlate well with turbidity beyond 5 NTU. Chlorophyll a Indicative of algal bloom occurrence. If water contains more 0.5 µg/L, the source water may be in an algal bloom condition.
Algal count, cells per milliliter Indicative of algal bloom occurrence. If water contains more than 2000 cells per milliliter, the source water is in an algal bloom condition.
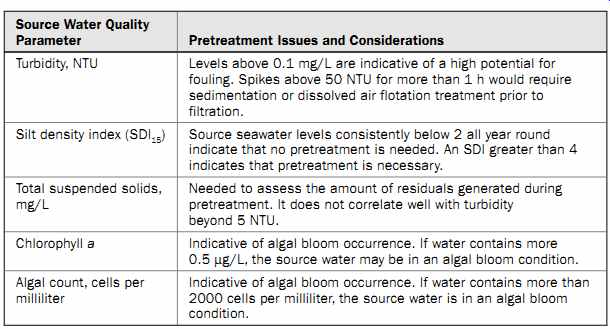
Table 4 Water Quality Parameters for Characterization of Particulate Foulants
========