AMAZON multi-meters discounts AMAZON oscilloscope discounts
VIBRATION DATA TYPES AND FORMATS
There are several options regarding the types of vibration data that can be gathered for machine-trains and systems and the formats in which the data can be collected.
Selection of type and format depends on the specific application. There are two major data-type classifications: time-domain and frequency-domain. Each of these can be further divided into steady-state and dynamic data formats. In turn, each of these two formats can be further divided into single-channel and multichannel.
Data Types
Vibration profiles can be acquired and displayed in one of two data types: time-domain or frequency-domain.
FIG. 17 Typical time-domain signature.
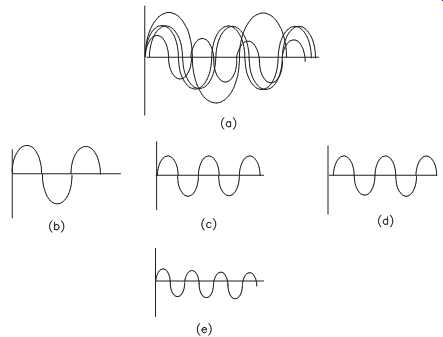
FIG. 18 Theoretical time-domain waveforms.
Time-Domain:
Most of the early vibration analysis was carried out using analog equipment, which necessitated the use of time-domain data, because it was difficult to convert time domain data to frequency-domain data. Therefore, frequency-domain capability was not available until microprocessor-based analyzers incorporated a straightforward method (i.e., Fast Fourier Transform, FFT) of transforming the time-domain spectrum into its frequency components.
Actual time-domain vibration signatures are commonly referred to as time traces or time plots (see FIG. 17). Theoretical vibration data are generally referred to as waveforms (see FIG. 18).
Time-domain data are presented with amplitude as the vertical axis and elapsed time as the horizontal axis. Time-domain profiles are the sum of all vibration components (i.e., frequencies, impacts, and other transients) that are present in the but the individual components are more difficult to isolate than with frequency-domain data.
The profile shown in FIG. 17 illustrates two different data acquisition points, one measured vertically and one measured horizontally, on the same machine and taken at the same time. Because they were obtained concurrently, these data points can be compared to determine the operating dynamics of the machine.
In this example, the data set contains an impact that occurred at 0.005 seconds. The impact is clearly visible in both the vertical (top) and horizontal (bottom) data set.
From these time traces, the vertical impact appears to be stronger than the horizontal.
In addition, the impact repeated at 0.015 and 0.025 seconds. Two conclusions can be derived from this example: (1) the impact source is a vertical force, and (2) it impacts the machine-train at an interval of 0.010 seconds, or frequency of 1/0.010 seconds equals 100Hz.
The waveform in FIG. 18 illustrates theoretically the unique frequencies and transients that may be present in a machine's signature. FIG. 18a illustrates the complexity of such a waveform by overlaying numerous frequencies. The discrete waveforms that make up FIG. 18a are displayed individually in FIGS. 18b through 7-18e. Note that two of the frequencies (c and d) are identical but have a different phase angle (f).
With time-domain data, the analyst must manually separate the individual frequencies and events that are contained in the complex waveform. This effort is complicated tremendously by the superposition of multiple frequencies. Note that, rather than over laying each of the discrete frequencies as illustrated theoretically in FIG. 18a, actual time-domain data represents the sum of these frequencies as was illustrated in FIG. 17.
In order to analyze this type of plot, the analyst must manually change the time scale to obtain discrete frequency curve data. The time interval between the recurrences of each frequency can then be measured. In this way, it’s possible to isolate each of the frequencies that make up the time-domain vibration signature.
For routine monitoring of machine vibration, however, this approach is not cost effective. The time required to manually isolate each of the frequency components and transient events contained in the waveform is prohibitive; however, time-domain data have a definite use in a total-plant predictive maintenance or reliability improvement program.
Machine-trains or process systems that have specific timing events (e.g., a pneumatic or hydraulic cylinder) must be analyzed using the time-domain data format.
In addition, time-domain data must be used for linear and reciprocating motion machinery.
FIG. 19 Typical frequency-domain signature.
Frequency-Domain:
Most rotating machine-train failures result at or near a frequency component associated with the running speed. Therefore, the ability to display and analyze the vibration spectrum as components of frequency is extremely important.
The frequency-domain format eliminates the manual effort required to isolate the components that make up a time trace. Frequency-domain techniques convert time-domain data into discrete frequency components using a mathematical process called Fast Fourier Transform (FFT). Simply stated, FFT mathematically converts a time-based trace into a series of discrete frequency components (see FIG. 19). In a frequency domain plot, the X-axis is frequency and the Y-axis is the amplitude of displacement, velocity, or acceleration.
With frequency-domain analysis, the average spectrum for a machine-train signature can be obtained. Recurring peaks can be normalized to present an accurate representation of the machine-train condition. FIG. 20 illustrates a simplified relationship between time-domain and frequency-domain analysis.
The real advantage of frequency-domain analysis is the ability to normalize each vibration component so that a complex machine-train spectrum can be divided into discrete components. This ability simplifies isolation and analysis of mechanical degradation within the machine-train.
In addition, frequency-domain analysis can be used to determine the phase relation ships for harmonic vibration components in a typical machine-train spectrum. Frequency-domain normalizes any or all running speeds, where time-domain analysis is limited to true running speed.
Mathematical theory shows that any periodic function of time, f(t), can be represented as a series of sine functions having frequencies w, 2w, 3w, 4w, and so on. Function f(t) is represented by the following equation, which is referred to as a Fourier Series:
FIG. 20 Relationship between time-domain and frequency-domain.
where:
Ax = Amplitude of each discrete sine wave
wt = Frequency
fx = Phase angle of each discrete sine wave
Each of these sine functions represents a discrete component of the vibration signature discussed previously. The amplitudes of each discrete component and their phase angles can be determined by integral calculus when the function f(t) is known. Because the subject of integral calculus is beyond the scope of this book, the math required to determine these integrals is not presented. A vibration analyzer and its associated soft ware perform this determination using FFT.
Data Formats
Both time-domain and frequency-domain vibration data can be acquired and analyzed in two primary formats: steady-state or dynamic. Each of these formats has strengths and weaknesses that must be clearly understood for proper use. In addition, each of these formats can be obtained as single- or multichannel data.
Steady-State:
Most vibration programs that use microprocessor-based analyzers are limited to steady-state data. Steady-state vibration data assumes that the machine-train or process system operates in a constant, or steady-state, condition. In other words, the machine is free of dynamic variables such as load, flow, and so on. This approach further assumes that all vibration frequencies are repeatable and maintain a constant relationship to the rotating speed of the machine's shaft.
Steady-state analysis techniques are based on acquiring vibration data when the machine or process system is operating at a fixed speed and specific operating parameters. For example, a variable-speed machine-train is evaluated at constant speed rather than over its speed range.
Steady-state analysis can be compared to a still photograph of the vibration profile generated by a machine or process system. Snapshots of the vibration profile are acquired by the vibration analyzer and stored for analysis. The snapshots can be used to evaluate the relative operating condition of simple machine-trains, but they don’t provide a true picture of the dynamics of either the machine or its vibration profile.
Steady-state analysis totally ignores variations in the vibration level or vibration generated by transient events such as impacts and changes in speed or process parameters. Instruments used to obtain the profiles contain electronic circuitry, which are specifically designed to eliminate transient data.
In the normal acquisition process, the analyzer acquires multiple blocks of data. As part of the process, the microprocessor compares each data block as it’s acquired. If a block contains a transient that is not included in subsequent blocks, the block containing the event is discarded and replaced with a transient-free block. As a result, steady-state analysis does not detect random events that may have a direct, negative effect on equipment reliability.
Dynamic:
While steady-state data provides a snapshot of the machine, dynamic or real-time data provide a motion picture. This approach provides a better picture of the dynamics of both the machine-train and its vibration profile. Data acquired using steady-state methods would suggest that vibration profiles and amplitudes are constant, but this is not true. All dynamic forces, including running speed, vary constantly in all machine trains. When real-time data acquisition methods are used, these variations are captured and displayed for analysis.
Single-Channel:
Most microprocessor-based vibration-monitoring programs rely on single-channel vibration data format. Single-channel data acquisition and analysis techniques are acceptable for routine monitoring of simple, rotating machinery; however, it’s important that single-channel analysis be augmented with multichannel and dynamic analysis. Total reliance on single-channel techniques severely limits the accuracy of analysis and the effectiveness of a predictive maintenance or reliability improvement program.
With the single-channel method, data are acquired in series or one channel at a time.
Normally, a series of data points is established for each machine-train and data are acquired from each point in a measurement route. Although this approach is more than adequate for routine monitoring of relatively simple machines, it’s based on the assumption that the machine's dynamics and the resultant vibration profile are constant throughout the entire data acquisition process. This approach hinders the ability to evaluate real-time relationships between measurement points on the machine-train and variations in process parameters such as speed, load, pressure, and so on.
Multichannel:
Multichannel data provide the best picture of the relationship between measurement points on a machine-train. Data are acquired simultaneously from all measurement points on the machine-train. With this type of data, the analyst can establish the relationship between machine dynamics and vibration profile of the entire machine.
In most cases, a digital tape recorder is used to acquire data from the machine. Because all measurement points are recorded at the same time, the resultant data can be used to compare the tri-axial vibration profile of all measurement points. This capability greatly enhances the analyst's ability to isolate abnormal machine dynamics and to determine the root-cause of deviations.
DATA ACQUISITION
It’s important for predictive maintenance programs using vibration analysis to have accurate, repeatable data. In addition to the type and quality of the transducer, three key parameters affect data quality: the point of measurement, orientation, and transducer-mounting techniques.
In a predictive and reliability maintenance program, it’s extremely important to keep good historical records of key parameters. How measurement point locations and orientation to the machine's shaft were selected should be kept as part of the database.
It’s important that every measurement taken throughout the life of the maintenance program be acquired at exactly the same point and orientation. In addition, the compressive load, or downward force, applied to the transducer should be exactly the same for each measurement.
FIG. 21 Displacement probe and signal conditioning system.
Vibration Detectors: Transducers and Cables
A variety of monitoring, trending, and analysis techniques that can and should be used as part of a total-plant vibration-monitoring program. Initially, such a program depends on the use of historical trends to detect incipient problems. As the program matures, however, other techniques such as frequency-domain signature analysis, time-domain analysis, and operating dynamics analysis are typically added.
An analysis is only as good as the data; therefore, the equipment used to collect the data is critical and determines the success or failure of a predictive maintenance or reliability improvement program. The accuracy as well as proper use and mounting determine whether valid data are collected.
Three basic types of vibration transducers can be used for monitoring the mechanical condition of plant machinery: displacement probes, velocity transducers, and accelerometers. Each has limitations and specific applications for which its use is appropriate.
Displacement Probes:
Displacement, or eddy-current, probes are designed to measure the actual movement, or displacement, of a machine's shaft relative to the probe. Data are normally recorded as peak-to-peak in mils, or thousandths of an inch. This value represents the maximum deflection or displacement from the true centerline of a machine's shaft. Such a device must be rigidly mounted to a stationary structure to obtain accurate, repeatable data.
See FIG. 21 for an illustration of a displacement probe and signal conditioning system.
FIG. 22 Schematic diagram of velocity pickup.
Permanently mounted displacement probes provide the most accurate data on machines with a rotor weight that is low relative to the casing and support structure.
Turbines, large compressors, and other types of plant equipment should have displacement transducers permanently mounted at key measurement locations.
The useful frequency range for displacement probes is from 10 to 1,000Hz, or 600 to 60,000 rpm. Frequency components above or below this range are distorted and, there fore, unreliable for determining machine condition.
The major limitation with displacement or proximity probes is cost. The typical cost for installing a single probe, including a power supply, signal conditioning, and so on, averages $1,000. If each machine to be evaluated requires 10 measurements, the cost per machine is about $10,000. Using displacement transducers for all plant machinery dramatically increases the initial cost of the program. Therefore, key locations are generally instrumented first, and other measurement points are added later.
Velocity Transducers:
Velocity transducers are electromechanical sensors designed to monitor casing, or relative, vibration. Unlike displacement probes, velocity transducers measure the rate of displacement rather than the distance of movement. Velocity is normally expressed in terms of inches per second (ips) peak, which is perhaps the best method of expressing the energy caused by machine vibration. FIG. 22 is a schematic diagram of a velocity measurement device.
Like displacement probes, velocity transducers have an effective frequency range of about 10 to 1,000Hz. They should not be used to monitor frequencies above or below this range.
The major limitation of velocity transducers is their sensitivity to mechanical and thermal damage. Normal use can cause a loss of calibration; therefore, a strict recalibration program is required to prevent data errors. At a minimum, velocity transducers should be recalibrated every six months. Even with periodic recalibration, however, velocity transducers are prone to distorting data as a result of loss of calibration.
Accelerometers:
Acceleration is perhaps the best method of determining the force resulting from machine vibration. Accelerometers use piezoelectric crystals or films to convert mechanical energy into electrical signals. FIG. 23 is a schematic of such a device.
Data acquired with this type of transducer are relative acceleration expressed in terms of the gravitational constant, g, in inches/second/second.
FIG. 23 Schematic diagram of accelerometer. (1) Base, (2) Piezoelectric crystals, (3) Mass, (4) Case.
The effective range of general-purpose accelerometers is from about 1Hz to 10,000 Hz. Ultrasonic accelerometers are available for frequencies up to 1MHz. In general, vibration data above 1,000Hz, or 60,000 cpm, should be taken and analyzed in acceleration or g's.
A benefit of the use of accelerometers is that they don’t require a calibration program to ensure accuracy; however, they are susceptible to thermal damage. If sufficient heat radiates into the piezoelectric crystal, it can be damaged or destroyed, but thermal damage is rare because data acquisition time is relatively short (less than 30 seconds) using temporary mounting techniques.
FIG. 24 Types of coiled cables.
Cables:
Most portable vibration data collectors use a coiled cable to connect to the transducer (see FIG. 24). The cable, much like a telephone cord, provides a relatively compact length when relaxed but will extend to reach distant measurement points. For general use, this type of cable is acceptable, but it cannot be used for all applications.
The coiled cable is not acceptable for low-speed (less than 300 rpm) applications or when there is a strong electromagnetic field. Because of its natural tendency to return to its relaxed length, the coiled cable generates a low-level frequency that corresponds to the oscillation rate of the cable. In low-speed applications, this oscillation frequency can mask real vibration that is generated by the machine. A strong electromagnetic field, such as that generated by large mill motors, accelerates cable oscillation. In these instances, the vibration generated by the cable will mask real machine vibration.
In these and other applications where the coiled cable distorts or interferes with the accuracy of acquired data, a shielded coaxial cable should be used. Although these non-coiled cables can be more difficult to use in conjunction with a portable analyzer, they are essential for low-speed and electromagnetic field applications.
Data Measurements
Most vibration-monitoring programs rely on data acquired from the machine housing or bearing caps. The only exceptions are applications that require direct measurement of actual shaft displacement to obtain an accurate picture of the machine's dynamics.
This section discusses the number and orientation of measurement points required to profile a machine's vibration characteristics.
The fact that both normal and abnormal machine dynamics tend to generate unbalanced forces in one or more directions increases the analyst's ability to determine the root-cause of deviations in the machine's operating condition. Therefore, measurements should be taken in both radial and axial orientations.
Radial Orientation:
Radially oriented measurements permit the analyst to understand the relationship of vibration levels generated by machine components where the forces are perpendicular to the shaft's centerline. For example, mechanical imbalance generates radial forces in all directions, but misalignment generally results in a radial force in a single direction that corresponds with the misaligned direction. The ability to determine the actual displacement direction of the machine's shaft and other components greatly improves diagnostic accuracy.
FIG. 25 Resultant shaft velocity vector based on radial vibration measurements.
Two radial measurement points located 90 degrees apart are required at each bearing cap. The two points permit the analyst to calculate the actual direction and relative amplitude of any displacement that is present within the machine.
FIG. 25 illustrates a simple vector analysis where the vertical and horizontal radial readings acquired from the outboard bearing cap indicate a relative vertical vibration velocity of 0.5 inches per second peak (IPS-PK) and a horizontal vibration velocity of 0.3 IPS-PK. Using simple geometry, the amplitude of vibration velocity (0.583 IPS PK) in the actual direction of deflection can be calculated.
Axial Orientation:
Axially oriented measurements are used to determine the lateral movement of a machine's shaft or dynamic mass. These measurement points are oriented in-line or parallel with the shaft or direction of movement.
At least one axial measurement is required for each shaft or dynamic movement. In the case of shafts with a combination of float and fixed bearings, readings should be taken from the fixed or stationary bearing to obtain the best data.
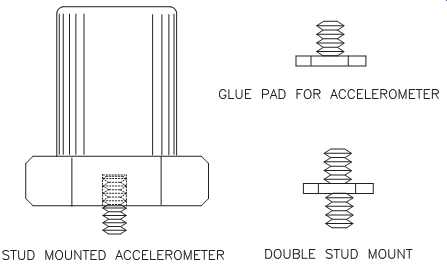
FIG. 26 Permanent mounts provide best repeatability.
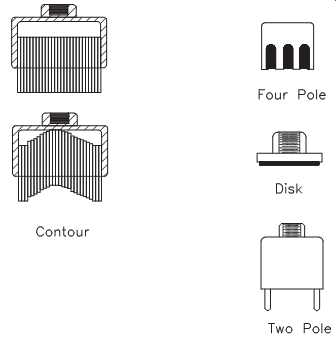
FIG. 27 Common magnetic mounts for transducers.
a. Orientation is not 90° to shaft centerline.
b. Measurement-point location is not always consistent.
c. Compressive load varies and may induce faulty readings.
(a) (b) (c)
FIG. 28 Handheld transducers should be avoided when possible.
Transducer Mounting Techniques
For accuracy of data, a direct mechanical link between the transducer and the machine's casing or bearing cap is necessary. This makes the method used to mount the transducer crucial to obtaining accurate data. Slight deviations in this link will induce errors in the amplitude of vibration measurement and may create false frequency components that have nothing to do with the machine.
Permanent:
The best method of ensuring that the point of measurement, its orientation, and the compressive load are exactly the same each time is to permanently or hard mount the transducers, which is illustrated in FIG. 26. This method guarantees accuracy and repeatability of acquired data, but it also increases the initial program cost. The average cost of installing a general-purpose accelerometer is about $300 per measurement point or $3,000 for a typical machine-train.
Quick Disconnect:
To eliminate the capital cost associated with permanently mounting transducers, a well-designed quick-disconnect mounting can be used instead. With this technique, a quick-disconnect stud with an average cost of less than $5 is permanently mounted at each measurement point. A mating sleeve built into the transducer is used to connect with the stud. A well-designed quick-disconnect mounting technique provides almost the same accuracy and repeatability as the permanent mounting technique, but at a much lower cost.
Magnets:
For general-purpose use below 1,000Hz, a transducer can be attached to a machine by a magnetic base. Even though the resonant frequency of the transducer/magnet assembly may distort the data, this technique can be used with some success. Because the magnet can be placed anywhere on the machine, however, it’s difficult to guarantee that the exact location and orientation is maintained with each measurement.
FIG. 27 shows common magnetic mounts for transducers.
Handheld:
Another method used by some plants to acquire data is handheld transducers.
This approach is not recommended if it’s possible to use any other method. Hand held transducers don’t provide the accuracy and repeatability required to gain maximum benefit from a predictive maintenance program. If this technique must be used, extreme care should be exercised to ensure that the same location, orientation, and compressive load are used for every measurement. FIG. 28 illustrates a hand held device.
Acquiring Data
Three factors must be considered when acquiring vibration data: settling time, data verification, and additional data that may be required.
Settling Time:
All vibration transducers require a power source that is used to convert mechanical motion or force to an electronic signal. In microprocessor-based analyzers, this power source is usually internal to the analyzer. When displacement probes are used, an external power source must be provided.
When the power source is turned on, there is a momentary surge of power into the transducer. This surge distorts the vibration profile generated by the machine. There fore, the data acquisition sequence must include a time delay between powering up and acquiring data. The time delay will vary based on the specific transducer used and type of power source.
Some vibration analyzers include a user-selected time delay that can automatically be downloaded as part of the measurement route. If this feature is included, the delay can be preprogrammed for the specific transducer that will be used to acquire data.
No further adjustment is required until the transducer type is changed.
In addition to the momentary surge created by energizing the power source, the mechanical action of placing the transducer on the machine creates a spike of energy that may distort the vibration profile. Therefore, the actual data acquisition sequence should include a 10- to 20-second delay to permit decay of the spike created by mounting the transducer.
Data Verification:
Several equipment problems can result in bad or distorted data. In addition to the surge and spike discussed in the preceding section, damaged cables, transducers, power sup plies, and other equipment failures can cause serious problems. Therefore, it’s essential to verify all data throughout the acquisition process.
Most of the microprocessor-based vibration analyzers include features that facilitate verification of acquired data. For example, many include a low-level alert that automatically alerts the technician when acquired vibration levels are below a preselected limit. If these limits are properly set, the alert should be sufficient to detect this form of bad data.
Unfortunately, not all distortions of acquired data result in a low-level alert. Damaged or defective cables or transducers can result in a high level of low-frequency vibration. As a result, the low-level alert won’t detect this form of bad data; however, the vibration signature will clearly display the abnormal profile that is associated with these problems.
In most cases, a defective cable or transducer generates a signature that contains a ski-slope profile, which begins at the lowest visible frequency and drops rapidly to the noise floor of the signature. If this profile is generated by defective components, it won’t contain any of the normal rotational frequencies generated by the machine-train.
With the exception of mechanical rub, defective cables and transducers are the only sources of this ski-slope profile. When mechanical rub is present, the ski slope will also contain the normal rotational frequencies generated by the machine-train. In some cases, it’s necessary to turn off the auto-scale function in order to see the rotational frequencies, but they will be evident. If no rotational components are present, the cable and transducer should be replaced.
Additional Data:
Data obtained from a vibration analyzer are not all that are required to evaluate machine-train or system condition. Variables, such as load, have a direct effect on the vibration profile of machinery and must be considered. Therefore, additional data should be acquired to augment the vibration profiles.
Most microprocessor-based vibration analyzers are capable of directly acquiring process variables and other inputs. The software and firmware provided with these systems generally support preprogrammed routes that include almost any direct or manual data input. These routes should include all data required to effectively analyze the operating condition of each machine-train and its process system.
VIBRATION ANALYSES TECHNIQUES
Techniques used in vibration analysis are trending, both broadband and narrowband; comparative analysis; and signature analysis.
Trending
Most vibration-monitoring programs rely heavily on historical vibration-level amplitude trends as their dominant analysis tool. This approach is valid if the vibration data are normalized to remove the influence of variables, such as load, on the recorded vibration energy levels. Valid trend data provide an indication of change over time within the monitored machine. As stated in preceding sections, a change in vibration amplitude indicates a corresponding change in operating condition that can be a useful diagnostic tool.
Broadband:
Broadband analysis techniques have been used to monitor the overall mechanical condition of machinery for more than 20 years. The technique is based on the overall vibration or energy from a frequency range of zero to the user-selected maximum frequency, FMAX.
Broadband data are overall vibration measurements expressed in units such as velocity-PK, acceleration-RMS, and so on. This type of data, however, does not provide any indication of the specific frequency components that make up the machine's vibration signature. As a result, specific machine-train problems cannot be isolated and identified.
The only useful function of broadband analysis is long-term trending of the gross overall condition of machinery. Typically, sets of alert/alarm limits are established to monitor the overall condition of the machine-trains in a predictive maintenance program; however, this approach has limited value and, when used exclusively, severely limits the ability to achieve the full benefit of a comprehensive program.
Narrowband:
Like broadband analysis, narrowband analysis also monitors the overall energy, but for a user-selected band of frequency components. The ability to select specific groups of frequencies, or narrowbands, increases the usefulness of the data. Using this technique can drastically reduce the labor required to monitor machine-trains and improve the accuracy of detecting incipient problems.
Unlike broadband data, narrowband data provide the ability to directly monitor, trend, and alarm specific machine-train components automatically by using a microprocessor for a window of frequencies unique to specific machine components. For example, a narrowband window can be established to directly monitor the energy of a gear set that consists of the primary gear-mesh frequency and corresponding sidebands.
Comparative Analysis
Comparative analysis directly compares two or more data sets in order to detect changes in the operating condition of mechanical or process systems. This type of analysis is limited to the direct comparison of the time-domain or frequency-domain signature generated by a machine. The method does not determine the actual dynamics of the system. Typically, the following data are used for this purpose: baseline data, known machine condition, or industrial reference data.
Note that great care must be taken when comparing machinery vibration data to industry standards or baseline data. The analyst must make sure the frequency and amplitude are expressed in units and running speeds that are consistent with the standard or baseline data. The use of a microprocessor-based system with software that automatically converts and displays the desired terms solves this problem.
Baseline Data:
Reference or baseline data sets should be acquired for each machine-train or process system to be included in a predictive maintenance program when the machine is installed or after the first scheduled maintenance once the program is established.
These data sets can be used as a reference or comparison data set for all future measurements; however, such data sets must represent the normal operating condition of each machine-train. Three criteria are critical to the proper use of baseline comparisons: reset after maintenance, proper identification, and process envelope.
Reset After Maintenance. The baseline data set must be updated each time the machine is repaired, rebuilt, or major maintenance is performed. Even when best practices are used, machinery cannot be restored to as-new condition when major maintenance is performed. Therefore, a new baseline or reference data set must be established following these events.
Proper Identification. Each reference or baseline data set must be clearly and completely identified. Most vibration-monitoring systems permit adding a label or unique identifier to any user-selected data set. This capability should be used to clearly identify each baseline data set. In addition, the data-set label should include all information that defines the data set. For example, any rework or repairs made to the machine should be identified. If a new baseline data set is selected after replacing a rotating element, this information should be included in the descriptive label.
Process Envelope. Because variations in process variables, such as load, have a direct effect on the vibration energy and the resulting signature generated by a machine train, the actual operating envelope for each baseline data set must also be clearly identified. If this step is omitted, direct comparison of other data to the baseline will be meaningless. The label feature in most vibration-monitoring systems permits tagging the baseline data set with this additional information.
Known Machine Condition:
Most microprocessor-based analyzers permit direct comparison to two machine-trains or components. The form of direct comparison, called cross-machine comparison, can be used to identify some types of failure modes.
When using this type of comparative analysis, the analyst compares the vibration energy and profile from a suspect machine to that of a machine with a known operating condition. For example, the suspect machine can be compared to the baseline reference taken from a similar machine within the plant. Or, a machine profile with a known defect, such as a defective gear, can be used as a reference to determine if the suspect machine has a similar profile and, therefore, a similar problem.
========
TBL. 2 Vibration-Severity Standards
(Inches/Second-Peak)
Machine Classes Condition I II III IV Good Operating Condition 0.028 0.042 0.100 0.156 Alert Limit 0.010 0.156 0.255 0.396 Alarm Limit 0.156 0.396 0.396 0.622 Absolute Fault Limit 0.260 0.400 0.620 1.000
* Applicable to a machine with running speed between 600 to 12,000 rpm.
Narrowband setting: 0.3x to 3.0x running speed.
Machine Class Descriptions:
Class I Small machine-trains or individual components integrally connected with the complete machine in its normal operating condition (i.e., drivers up to 20 horsepower).
Class II Medium-sized machines (i.e., 20- to 100-horsepower drivers and 400-horsepower drivers on special foundations.
Class III Large prime movers (i.e., drivers greater than 100 horsepower) mounted on heavy, rigid foundations.
Class IV Large prime movers (i.e., drivers greater than 100 horsepower) mounted on relatively soft, light weight structures.
Source: Derived by Integrated Systems, Inc. from ISO Standard #2372.
========
Industrial Reference Data:
One form of comparative analysis is direct comparison of the acquired data to industrial standards or reference values. The International Standards Organization (ISO) established the vibration-severity standards presented in TBL. 2. These data are applicable for comparison with filtered narrowband data taken from machine-trains with true running speeds between 600 and 12,000 rpm. The values from the table include all vibration energy between a lower limit of 0.3x true running speed and an upper limit of 3.0x. For example, an 1,800-rpm machine would have a filtered narrowband between 540 (1,800 x 0.3) and 5,400 rpm (1,800 x 3.0). A3,600-rpm machine would have a filtered narrowband between 1,080 (3,600 x 0.3) and 10,800 rpm (3,600 x 3.0).
Signature Analysis
The phrase "full Fast Fourier Transform (FFT) signature" is usually applied to the vibration spectrum that uniquely identifies a machine, component, system, or subsystem at a specific operating condition and time. It provides specific data on every frequency component within the overall frequency range of a machine-train. The typical frequency range can be from 0.1 to 30,000Hz.
In microprocessor systems, the FFT signature is formed by breaking down the total frequency spectrum into unique components, or peaks. Each line or peak represents a specific frequency component that, in turn, represents one or more mechanical components within the machine-train. Typical microprocessor-based predictive maintenance systems can provide signature resolutions of at least 400 lines, and many provide 12,800 lines or more.
Full-signature spectra are an important analysis tool, but they require a tremendous amount of microprocessor memory. It’s impractical to collect full, high-resolution spectra on all machine-trains on a routine basis. Data management and storage in the host computer is extremely difficult and costly. Full-range signatures should be collected only if a confirmed problem has been identified on a specific machine-train.
This can be triggered automatically by exceeding a preset alarm limit in the historical amplitude trends.
Broadband and Full Signature:
Systems that use either broadband or full-signature measurements have limitations that may hamper the program's usefulness. Broadband measurements usually don’t have enough resolution at running speeds to be effective in early problem diagnostics. Full-signature measurement at every data point requires a massive data acquisition, handling, and storage system that greatly increases the capital and operating costs of the program.
Normally, a full-signature spectrum is needed only when an identified machine-train problem demands further investigation. Please note that although full signatures generate too much data for routine problem detection, they are essential for root-cause diagnostics. Therefore, the optimum system includes the capability to use all techniques. This ability optimizes the program's ability to trend, perform full root-cause failure analysis, and still maintain minimum data management and storage requirements.
Narrowband:
Typically, a machine-train's vibration signature consists of vibration components with each component associated with one or more of the true running speeds within the machine-train. Because most machinery problems show up at or near one or more of the running speeds, the narrowband capability is beneficial in that high-resolution windows can be preset to monitor the running speeds; however, many of the micro processor-based predictive maintenance systems available don’t have narrowband capability. Therefore, care should be taken to ensure that the system used does have this capability.
SUB-SECTION ---Abbreviations
A Acceleration A Zero-to-peak amplitude Cpm Cycles per minute or cycles/minute Cps Cycles per second or cycles/second e.g. , for example F Frequency f(t) Function of time F Force FFT Fast Fourier Transform FMAX Maximum frequency FMIN Minimum frequency F0 External force Fs Spring force G Gravitational constant, 32.17 ft/sec2 H Elongation caused by the weight of the mass Hz Hertz i.e., That is in. Inches Ips Inches per second or inches/second ips-PK Inches per second, zero-to-peak K Torsional stiffness K Spring constant or stiffness Lbf Pounds-force Lbm Pounds-mass L0 Unelongated spring length M Mass MHz Megahertz PK Zero-to-peak RMS Root-mean-square Rpm Revolutions per minute or revolutions/minute sec2 Seconds squared T Time T Period or Torque T0 External torque VPM Vibrations per minute or vibrations/minute W Weight X Displacement Xi Static displacement X0 Amount of displacement from Xi 1x, 2x, 3x 1 times, 2 times, 3 times
Glossary
- Acceleration -- The rate of change of velocity with respect to time (ft/sec^2 ) or (in/sec^2 ).
- Accelerometer -- Transducer used to measure acceleration. Incorporates a piezoelectric crystal or film to convert mechanical energy into electrical signals.
- Amplitude -- The magnitude or size of a quantity such as displacement, velocity, acceleration, etc., measured by a vibration analyzer in con junction with a displacement probe, velocity transducer, or accelerometer.
- Axial -- Of, on, around, or along an axis (straight line about which an object rotates) or center of rotation.
- Bearing cap---The protective structure that covers bearings.
- Boundary condition---Mathematically defined as a requirement to be met by a solution to a set of differential equations on a specified set of values of the independent variables.
- Displacement---The change in distance or position of an object relative to a reference point, usually measured in mils.
- Dynamics, operating--Deals with the motion of a system under the influence of forces, especially those that originate outside the system under consideration.
- Fast Fourier Transform (FFT) A mathematical technique used to convert a time-domain plot into its unique frequency components.
- Force---That influence on a body that causes it to accelerate. Quantitatively, it’s a vector equal to the body's time rate of change of momentum.
- Forcing function---The cause of each discrete frequency component in a machine-train's vibration signature.
- Frequency---Frequency, f, is defined as the number of repetitions of a specific forcing function or vibration component over a specific unit of time. It’s the inverse of the period, , of the vibration and can be expressed in units of cycles per second (cps) or Hertz (Hz). For rotating machinery, the frequency is often expressed in vibrations per minute (vpm).
- Frequency, circular---Another measure of frequency measured in radians (w = 2p f).
- Frequency, natural---All components have one or more natural frequencies that can be excited by an energy source that coincides with, or is in proximity to, that frequency. The result is a substantial increase in the amplitude of the natural frequency vibration component, which is referred to as resonance. Higher levels of input energy can cause catastrophic, near instantaneous failure of the machine or structure.
- Frequency, primary The base frequency referred to in a vibration analysis that includes vibrations that are harmonics of the primary frequency.
- Gravitational constant The constant of proportionality in the English system of units, gc, which causes one pound of mass to produce one pound of force under the acceleration of gravity, equal to 32.17 lbm-ft/lbf-sec^2.
- Harmonic motion A periodic motion or vibration that is a sinusoidal function of time, that is, motion along a line given by equation x = a cos(wt +f), where t is time, a and w are constants, and f is the phase angle. For example, X = X0 sin (wt + f) where X is the displacement, X0 is the amplitude, w is the circular frequency, and f is the phase angle.
- Harmonics Multiples of the primary frequency (e.g., 2x, 3x).
- Hertz Unit of frequency; a periodic oscillation has a frequency of n hertz if in one second it goes through n cycles.
- Imbalance A condition that can result from a mechanical and/or a force imbalance. Mechanical imbalance is when there is more weight on one side of a centerline of a rotor than on the other. Force imbalance can result when there is an imbalance of the centripetal forces generated by rotation and/or when there is an imbalance between the lift generated by the rotor and gravity.
- Machine element---Rotating-machine components, such as rolling-element bearings, impellers, and other rotors, that turn with a shaft.
- Machine-train A series of machines containing both driver and driven components.
- Maintenance management program---A comprehensive program that includes predictive maintenance techniques to monitor and analyze critical machines, equipment, and systems in a typical plant. Techniques include vibration analysis, ultrasonics, thermography, tribology, process monitoring, visual inspection, and other nondestructive analysis methods.
- Maximum frequency---Broadband analysis techniques, which are used to monitor the overall mechanical condition of machinery, are based on the overall vibration or energy from a frequency range of zero to the user-selected maximum frequency (FMAX).
- Mil One one-thousandth of an inch (0.001 inch).
- Moment of inertia---The sum of the products formed by multi plying the mass of each element of a body by the square of its distance from a specified line. Also known as rotational inertia.
- Oscillate To move back and forth with a steady, uninterrupted rhythm.
- Periodic motion---A motion that repeats after a certain interval.
- Phase angle---The difference between the phase of a sinusoidally varying quantity and the phase of a second quantity that varies sinusoidally at the same frequency. Also known as phase difference.
- Piezoelectric---Describes a crystal or film that can generate a voltage when mechanical force is applied or produce a mechanical force when a voltage is applied.
- Predictive maintenance---The practice of using actual operating conditions of plant equipment and systems to optimize total plant operation. Relies on direct equipment monitoring to determine the actual mean-time-to-failure or loss of efficiency for each machine-train and system in a plant. This technique is used in place of traditional run-to-failure programs.
- Profile -- Refers to either time-domain (also may be called time trace or waveform) or frequency domain vibration curves.
- Quadratic---Any second-degree expression.
- Radial -- Extending from a point or center in the manner of rays (as the spokes of a wheel are radial).
- Radian The central angle of a circle determined by two radii and an arc joining them, all of the same length. A circle consists of 2p radians.
- Reciprocation The action of moving back and forth alternately.
- Signature---A frequency-domain vibration curve.
- Spring constant---The number of pounds tension necessary to extend the spring one inch. Also referred to as stiffness or spring modulus.
- Thermography Use of heat emissions of machinery or plant equipment as a monitoring and diagnostic predictive maintenance tool. For example, temperature differences on a coupling indicate misalignment and/or uneven mechanical forces.
- Torque---A moment/force couple applied to a rotor such as a shaft in order to sustain acceleration/load requirements. A twisting load imparted to shafts as the result of induced loads/speeds.
- Transducer---Any device or element that converts an input signal into an output signal of a different form.
- Tribology Science of rotor-bearing-support system design and operation. Predictive maintenance technique that uses spectrographic, wear particle, ferrography, and other measurements of the lubricating oil as a diagnostic tool.
- Turbulent flow Motion of fluids in which local velocities and pressures fluctuate irregularly and randomly.
- Ultrasonic analysis Predictive maintenance technique that uses principles similar to those of vibration analysis to monitor the noise generated by plant machinery or systems to determine their actual operating condition. Ultrasonics is used to monitor the higher frequencies (i.e., ultrasound) that range between 20,000 Hertz and 100 kiloHertz.
- Vector A quantity that has both magnitude and direction, and whose components transform from one coordinate system to another in the same manner as the components of a displacement.
- Velocity The time rate of change of position of a body. It’s a vector quantity with direction as well as magnitude.
- Vibration A continuing periodic change in a displacement with respect to a fixed reference. The motion will repeat after a certain interval.
- Vibration analysis Vibration analysis monitors the noise or vibrations generated by plant machinery or systems to determine their actual operating condition. The normal monitoring range for vibration analysis is from less than 1 up to 20,000 Hertz.
References:
- Hardenbergh, Donald E. 1963. Introduction to Dynamics. New York: Holt, Rinehart and Winston.
- Higgins, Lindley, and R. Keith Mobley. 1995. Maintenance Engineering Handbook. New York: McGraw-Hill.
- Mobley, R. Keith. 1989. Advanced Diagnostics and Analysis. Knoxville, TN: Technology for Energy Corp.
- Mobley, R. Keith. 1990. Introduction to Predictive Maintenance. New York: Van Nostrand Reinhold.
- Mobley, R. Keith. 1999. Vibration Fundamentals. Boston: Butterworth-Heinemann.