AMAZON multi-meters discounts AMAZON oscilloscope discounts
AMAZON multi-meters discounts
AMAZON oscilloscope discounts
.
.A variety of technologies can, and should be, used as part of a comprehensive
predictive maintenance program. Because mechanical systems or machines account
for most plant equipment, vibration monitoring is generally the key component
of most predictive maintenance programs; however, vibration monitoring cannot
provide all of the information required for a successful predictive maintenance
program. This technique is limited to monitoring the mechanical condition and
not other critical parameters required to maintain reliability and efficiency
of machinery. It’s a very limited tool for monitoring critical process and
machinery efficiencies and other parameters that can severely limit productivity
and product quality.
Therefore, a comprehensive predictive maintenance program must include other monitoring and diagnostic techniques. These techniques include vibration monitoring, thermography, tribology, process parameters, visual inspection, ultrasonics, and other nondestructive testing techniques. This section provides a brief description of each of the techniques that should be included in a full-capabilities predictive maintenance program for typical plants. Subsequent sections provide a more detailed description of these techniques and how they should be used as part of an effective maintenance management tool.
VIBRATION MONITORING
Because most plants consist of electromechanical systems, vibration monitoring is the primary predictive maintenance tool. Over the past 10 years, most of these programs have adopted the use of microprocessor-based, single-channel data collectors and Windows -based software to acquire, manage, trend, and evaluate the vibration energy created by these electromechanical systems. Although this approach is a valuable predictive maintenance methodology, these systems' limitations may restrict potential benefits.
Technology Limitations
Computer-based systems have several limitations. In addition, some system characteristics, particularly simplified data acquisition and analysis, provide both advantages and disadvantages.
Simplified Data Acquisition and Analysis:
While providing many advantages, simplified data acquisition and analysis can also be a liability. If the database is improperly con figured, the automated capabilities of these analyzers will yield faulty diagnostics that can allow catastrophic failure of critical plant machinery.
Because technician involvement is reduced to a minimum, the normal tendency is to use untrained or partially trained personnel for this repetitive function. Unfortunately, the lack of training results in less awareness and knowledge of visual and audible clues that can, and should be, an integral part of the monitoring program.
Single-Channel Data:
Most of the microprocessor-based vibration-monitoring systems collect single channel, steady-state data that cannot be used for all applications. Single-channel data are limited to the analysis of simple machinery that operates at relatively constant speed.
Although most microprocessor-based instruments are limited to a single input channel, in some cases, a second channel is incorporated in the analyzer; however, this second channel generally is limited to input from a tachometer, or a once-per-revolution input signal. This second channel cannot be used for vibration data capture.
This limitation prohibits the use of most microprocessor-based vibration analyzers for complex machinery or machines with variable speeds. Single-channel data acquisition technology assumes the vibration profile generated by a machine-train remains constant throughout the data acquisition process. This is generally true in applications where machine speed remains relatively constant (i.e., within 5 to 10 rpm). In this case, its use does not severely limit diagnostic accuracy and can be effectively used in a predictive maintenance program.
Steady-State Data:
Most of the microprocessor-based instruments are designed to handle steady-state vibration data. Few have the ability to reliably capture transient events such as rapid speed or load changes. As a result, their use is limited in situations where these changes occur.
In addition, vibration data collected with a microprocessor-based analyzer are filtered and conditioned to eliminate nonrecurring events and their associated vibration profiles. Anti-aliasing filters are incorporated into the analyzers specifically to remove spurious signals such as impacts or transients. Although the intent behind the use of anti-aliasing filters is valid, their use can distort a machine's vibration profile.
Because vibration data are dynamic and the amplitudes constantly change, as shown in FIG. 1, most predictive maintenance system vendors strongly recommend averaging the data. They typically recommend acquiring 3 to 12 samples of the vibration profile and averaging the individual profiles into a composite signature. This approach eliminates the variation in vibration amplitude of the individual frequency components that make up the machine's signature; however, these variations, referred to as beats, can be a valuable diagnostic tool. Unfortunately, they are not avail able from microprocessor-based instruments because of averaging and other system limitations.
The most serious limitations created by averaging and the anti-aliasing filters are the inability to detect and record impacts that often occur within machinery. These impacts generally are indications of abnormal behavior and are often the key to detecting and identifying incipient problems.
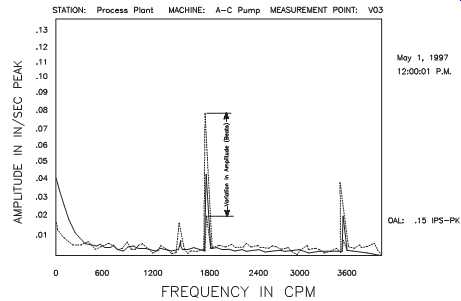
FIG. 1 Vibration is dynamic and amplitudes constantly change.
Frequency-Domain Data:
Most predictive maintenance programs rely almost exclusively on frequency-domain vibration data. The microprocessor-based analyzers gather time-domain data and automatically convert it using Fast Fourier Transform (FFT) to frequency-domain data. A frequency-domain signature shows the machine's individual frequency components, or peaks.
While frequency-domain data analysis is much easier to learn than time-domain data analysis, it cannot isolate and identify all incipient problems within the machine or its installed system. Because of this limitation, additional techniques (e.g., time-domain, multichannel, and real-time analysis) must be used in conjunction with frequency domain data analysis to obtain a complete diagnostic picture.
Low-Frequency Response:
Many of the microprocessor-based vibration-monitoring analyzers cannot capture accurate data from low-speed machinery or machinery that generates low frequency vibration. Specifically, some of the commercially available analyzers cannot be used where frequency components are below 600 cycles per minute (cpm) or 10Hz.
Two major problems restricting the ability to acquire accurate vibration data at low frequencies are electronic noise and the response characteristics of the transducer. The electronic noise of the monitored machine and the "noise floor" of the electronics within the vibration analyzer tend to override the actual vibration components found in low-speed machinery.
Analyzers especially equipped to handle noise are required for most industrial applications. At least three commercially available microprocessor-based analyzers are capable of acquiring data below 600 cpm. These systems use special filters and data acquisition techniques to separate real vibration frequencies from electronic noise. In addition, transducers with the required low-frequency response must be used.
Averaging:
All machine-trains are subject to random, nonrecurring vibrations as well as periodic vibrations. Therefore, it’s advisable to acquire several sets of data and average them to eliminate the spurious signals. Averaging also improves the repeatability of the data because only the continuous signals are retained.
Typically, a minimum of three samples should be collected for an average; however, the factor that determines the actual number is time. One sample takes 3 to 5 seconds, a four-sample average takes 12 to 20 seconds, and a 1,000-sample average takes 50 to 80 minutes to acquire. Therefore, the final determination is the amount of time that can be spent at each measurement point. In general, three to four samples are accept able for good statistical averaging and keeping the time required per measurement point within reason. Exceptions to this recommendation include low-speed machinery, transient-event capture, and synchronous averaging.
========
TBL. 1 Overlap Averaging Options
Overlap, % ---- Description
0 No overlap. Data trace update rate is the same as the block-processing rate.
This rate is governed by the physical requirements that are internally driven by the frequency range of the requested data.
25% Terminates data acquisition when 75% of each block of new data is acquired.
The last 25% of the previous sample (of the 75%) will be added to the new sample before processing is begun. Therefore, 75% of each sample is new.
As a result, accuracy may be reduced by as much as 25% for each data set.
50% The last 50% of the previous block is added to a new 50% or half-block of data for each sample. When the required number of samples is acquired and processed, the analyzer averages the data set. Accuracy may be reduced to 50%.
75% Each block of data is limited to 25% new data and the last 75% of the previous block.
90% Each block contains 10% new data and the last 90% of the previous block.
Accuracy of average data using 90% overlap is uncertain. Since each block used to create the average contains only 10% of actual data and 90% of a block that was extrapolated from a 10% sample, the result cannot be representative of the real vibration generated by the machine-train.
========
Overlap Averaging:
Many of the microprocessor-based vibration-monitoring systems offer the ability to increase their data acquisition speed. This option is referred to as overlap averaging.
Although this approach increases speed, it’s not generally recommended for vibration analysis. Overlap averaging reduces the data accuracy and must be used with caution. Its use should be avoided except where fast transients or other unique machine-train characteristics require an artificial means of reducing the data acquisition and processing time.
When sampling time is limited, a better approach is to reduce or eliminate averaging altogether in favor of acquiring a single data block, or sample. This reduces the acquisition time to its absolute minimum. In most cases, the single-sample time interval is less than the minimum time required to obtain two or more data blocks using the maximum overlap-averaging sampling technique. In addition, single-sample data are more accurate.
TBL. 1 describes overlap-averaging options. Note that the approach described in this table assumes that the vibration profile of monitored machines is constant.
Excluding Machine Dynamics:
Perhaps the most serious diagnostic error made by typical vibration-monitoring pro grams is the exclusive use of vibration-based failure modes as the diagnostic logic.
For example, most of the logic trees state that when the dominant energy contained in a vibration signature is at the fundamental running speed, then a state of unbalance exists. Although some forms of unbalance will create this profile, the rules of machine dynamics clearly indicate that all failure modes on a rotating machine will increase the amplitude of the fundamental or actual running speed.
Without a thorough understanding of machine dynamics, it’s virtually impossible to accurately diagnose the operating condition of critical plant production systems.
For example, gear manufacturers don’t finish the backside (i.e., nondrive side) of gear teeth. Therefore, any vibration acquired from a gear set when it’s braking will be an order of magnitude higher than when it’s operating on the power side of the gear.
Another example is even more common. Most analysts ignore the effect of load on a rotating machine. If you were to acquire a vibration reading from a centrifugal compressor when it’s operating at full load, it may generate an overall level of 0.1 ips peak. The same measurement point will generate a reading in excess of 0.4 ips-peak when the compressor is operating at 50 percent load. The difference is the spring constant that is being applied to the rotating element. The spring constant or stiffness at 100 percent load is twice that of that when operating at 50 percent; however, spring constant is a quadratic function. A reduction of 50 percent in the spring constant will increase the vibration level by a factor of four.
To achieve maximum benefits from vibration monitoring, the analyst must understand the limitations of the instrumentation and the basic operating dynamics of machinery.
Without this knowledge, the benefits will be dramatically reduced.
Application Limitations:
The greatest mistake made by traditional application of vibration monitoring is in its application. Most programs limit the use of this predictive maintenance technology to simple rotating machinery and not to the critical production systems that produce the plant's capacity. As a result, the auxiliary equipment is kept in good operating condition, but the plant's throughput is unaffected.
Vibration monitoring is not limited to simple rotating equipment. The microprocessor-based systems used for vibration analysis can be used effectively on all electro mechanical equipment-no matter how complex or what form the mechanical motion may take. For example, it can be used to analyze hydraulic and pneumatic cylinders that are purely linear motion. To accomplish this type of analysis, the analyst must use the time-domain function that is built into these instruments. Proper operation of cylinders is determined by the time it takes for the cylinder to finish one complete motion. The time required for the cylinder to extend is shorter than its return stroke.
This is a function of the piston area and inlet pressure. By timing the transient from fully retracted or extended to the opposite position, the analyst can detect packing leakage, scored cylinder walls, and other failure modes.
Vibration monitoring must be focused on the critical production systems. Each of these systems must be evaluated as a single machine and not as individual components. For example, a paper machine, annealing line, or any other production system must be analyzed as a complete machine-not as individual gearboxes, rolls, or other components. This methodology permits the analyst to detect abnormal operation within the complex system. Problems such as tracking, tension, and product-quality deviations can be easily detected and corrected using this method.
When properly used, vibration monitoring and analysis is the most powerful predictive maintenance tool available. It must be focused on critical production systems, not simple rotating machinery. Diagnostic logic must be driven by the operating dynamics of machinery-not simplified vibration failure modes.
The proof is in the results. The survey conducted by Plant Services in July 1999 indicated that less than 50 percent of the vibration-monitoring programs generated enough quantifiable benefits to offset the recurring cost of the program. Only 3 percent generated a return on investment of 5 percent. When properly used, vibration-based predictive maintenance can generate return on investment of 100:1 or better.
THERMOGRAPHY
Thermography is a predictive maintenance technique that can be used to monitor the condition of plant machinery, structures, and systems, not just electrical equipment.
It uses instrumentation designed to monitor the emission of infrared energy (i.e., surface temperature) to determine operating condition. By detecting thermal anomalies (i.e., areas that are hotter or colder than they should be), an experienced technician can locate and define a multitude of incipient problems within the plant.
Infrared technology is predicated on the fact that all objects having a temperature above absolute zero emit energy or radiation. Infrared radiation is one form of this emitted energy. Infrared emissions, or below red, are the shortest wavelengths of all radiated energy and are invisible without special instrumentation. The intensity of infrared radiation from an object is a function of its surface temperature; however, temperature measurement using infrared methods is complicated because three sources of thermal energy can be detected from any object: energy emitted from the object itself, energy reflected from the object, and energy transmitted by the object.
Only the emitted energy is important in a predictive maintenance program. Reflected and transmitted energies will distort raw infrared data. Therefore, the reflected and transmitted energies must be filtered out of acquired data before a meaningful analysis can be completed.
Variations in surface condition, paint or other protective coatings, and many other variables can affect the actual emissivity factor for plant equipment. In addition to reflected and transmitted energy, the user of thermographic techniques must also consider the atmosphere between the object and the measurement instrument. Water vapor and other gases absorb infrared radiation. Airborne dust, some lighting, and other variables in the surrounding atmosphere can distort measured infrared radiation. Because the atmospheric environment is constantly changing, using thermographic techniques requires extreme care each time infrared data are acquired.
Most infrared-monitoring systems or instruments provide filters that can be used to avoid the negative effects of atmospheric attenuation of infrared data; however, the plant user must recognize the specific factors that affect the accuracy of the infrared data and apply the correct filters or other signal conditioning required to negate that specific attenuating factor or factors.
Collecting optics, radiation detectors, and some form of indicator are the basic elements of an industrial infrared instrument. The optical system collects radiant energy and focuses it on a detector, which converts it into an electrical signal. The instrument's electronics amplifies the output signal and processes it into a form that can be displayed.
Types of Thermographic Systems
Three types of instruments are generally used as part of an effective predictive maintenance program: infrared thermometers, line scanners, and infrared imaging systems.
Infrared Thermometers:
Infrared thermometers or spot radiometers are designed to provide the actual surface temperature at a single, relatively small point on a machine or surface. Within a predictive maintenance program, the point-of-use infrared thermometer can be used in conjunction with many of the microprocessor-based vibration instruments to monitor the temperature at critical points on plant machinery or equipment. This technique is typically used to monitor bearing cap temperatures, motor winding temperatures, spot checks of process piping temperatures, and similar applications. It’s limited in that the temperature represents a single point on the machine or structure; however, when used in conjunction with vibration data, point-of-use infrared data can be a valuable tool.
Line Scanners:
This type of infrared instrument provides a one-dimensional scan or line of comparative radiation. Although this type of instrument provides a somewhat larger field of view (i.e., area of machine surface), it’s limited in predictive maintenance applications.
Infrared Imaging:
Unlike other infrared techniques, thermal or infrared imaging provides the means to scan the infrared emissions of complete machines, process, or equipment in a very short time. Most of the imaging systems function much like a video camera. The user can view the thermal emission profile of a wide area by simply looking through the instrument's optics.
A variety of thermal imaging instruments are on the market, ranging from relatively inexpensive, black-and-white scanners to full-color, microprocessor-based systems.
Many of the less expensive units are designed strictly as scanners and cannot store and recall thermal images. This inability to store and recall previous thermal data will limit a long-term predictive maintenance program.
Point-of-use infrared thermometers are commercially available and relatively inexpensive. The typical cost for this type of infrared instrument is less than $1,000.
Infrared imaging systems will have a price range between $8,000 for a black-and white scanner without storage capability to over $60,000 for a microprocessor-based, color imaging system.
Training is critical with any of the imaging systems. The variables that can destroy the accuracy and repeatability of thermal data must be compensated for each time infrared data are acquired. In addition, interpretation of infrared data requires extensive training and experience.
Inclusion of thermography into a predictive maintenance program will enable you to monitor the thermal efficiency of critical process systems that rely on heat transfer or retention, electrical equipment, and other parameters that will improve both the reliability and efficiency of plant systems. Infrared techniques can be used to detect problems in a variety of plant systems and equipment, including electrical switchgear, gearboxes, electrical substations, transmissions, circuit breaker panels, motors, building envelopes, bearings, steam lines, and process systems that rely on heat retention or transfer.
Infrared Thermography Safety
Equipment included in an infrared thermography inspection is usually energized; therefore, a lot of attention must be given to safety. The following are basic rules for safety while performing an infrared inspection:
• Plant safety rules must be followed at all times.
• A safety person must be used at all times. Because proper use of infrared imaging systems requires the technician to use a viewfinder, similar to a video camera, to view the machinery to be scanned, he or she is blind to the surrounding environment. Therefore, a safety person is required to ensure safe completion.
• Notify area personnel before entering the area for scanning.
• A qualified electrician from the area should be assigned to open and close all electrical panels.
• Where safe and possible, all equipment to be scanned will be online and under normal load with a clear line of sight to the item.
• Equipment whose covers are interlocked without an interlock defect mechanism should be shut down when allowable. If safe, their control covers should be opened and equipment restarted.
When used correctly, thermography is a valuable predictive maintenance and/or reliability tool; however, the derived benefits are directly proportional to how it’s used.
If it’s limited to annual surveys of roofs and/or quarterly inspections of electrical systems, the resultant benefits are limited. When used to regularly monitor all critical process or production systems where surface temperature or temperature distribution indicates reliability or operating condition, thermography can yield substantial benefits. To gain the maximum benefits from your investment in infrared systems, you must use its full power. Concentrate your program on those critical systems that generate capacity in your plant.
TRIBOLOGY
Tribology is the general term that refers to design and operating dynamics of the bearing-lubrication-rotor support structure of machinery. Two primary techniques are being used for predictive maintenance: lubricating oil analysis and wear particle analysis.
Lube Oil Analysis
Lubricating oil analysis, as the name implies, is an analysis technique that determines the condition of lubricating oils used in mechanical and electrical equipment. It’s not a tool for determining the operating condition of machinery or detecting potential failure modes. Too many plants are attempting to accomplish the latter and are disappointed in the benefits that are derived. Simply stated, lube oil analysis should be limited to a proactive program to conserve and extend the useful life of lubricants.
Although some forms of lubricating oil analysis may provide an accurate quantitative breakdown of individual chemical elements-both oil additive and contaminants contained in the oil-the technology cannot be used to identify the specific failure mode or root-cause of incipient problems within the machines serviced by the lube oil system.
The primary applications for lubricating oil analysis are quality control, reduction of lubricating oil inventories, and determination of the most cost-effective interval for oil change. Lubricating, hydraulic, and dielectric oils can be periodically analyzed using these techniques to determine their condition. The results of this analysis can be used to determine if the oil meets the lubricating requirements of the machine or application. Based on the results of the analysis, lubricants can be changed or upgraded to meet the specific operating requirements.
In addition, detailed analysis of the chemical and physical properties of different oils used in the plant can, in some cases, allow consolidation or reduction of the number is between $30,000 and $60,000. Because of this, most predictive maintenance pro grams rely on third-party analysis of oil samples.
Recurring Cost:
In addition to the labor cost associated with regular gathering of oil and grease samples, simple lubricating oil analysis by a testing laboratory will range from about
$20 to $50 per sample. Standard analysis will normally include viscosity, flash point, total insolubles, total acid number (TAN), total base number (TBN), fuel content, and water content. More detailed analysis, using spectrographic, ferrographic, or wear particle techniques that include metal scans, particle distribution (size), and other data can cost more than $150 per sample.
Accurate Samples:
A more severe limiting factor with any method of oil analysis is acquiring accurate samples of the true lubricating oil inventory in a machine. Sampling is not a matter of opening a port somewhere in the oil line and catching a pint sample. Extreme care must be taken to acquire samples that truly represent the lubricant that will pass through the machine's bearings. One recent example is an attempt to acquire oil samples from a bullgear compressor. The lubricating oil filter had a sample port on the clean (i.e., downstream) side; however, comparison of samples taken at this point and one taken directly from the compressor's oil reservoir indicated that more contaminants existed downstream from the filter than in the reservoir. Which location actually represented the oil's condition? Neither sample was truly representative of the oil's condition. The oil filter had removed most of the suspended solids (i.e., metals and other insolubles) and was therefore not representative of the actual condition. The reservoir sample was also not representative because most of the suspended solids had settled out in the sump.
Proper methods and frequency of sampling lubricating oil are critical to all predictive maintenance techniques that use lubricant samples. Sample points that are consistent with the objective of detecting large particles should be chosen. In a recirculating system, samples should be drawn as the lubricant returns to the reservoir and before any filtration occurs. Don’t draw oil from the bottom of a sump where large quantities of material build up over time. Return lines are preferable to reservoir as the sample source, but good reservoir samples can be obtained if careful, consistent practices are used. Even equipment with high levels of filtration can be effectively monitored as long as samples are drawn before oil enters the filters. Sampling techniques involve taking samples under uniform operating conditions. Samples should not be taken more than 30 minutes after the equipment has been shut down.
Sample frequency is a function of the mean-time-to-failure (MTTF) from the onset of an abnormal wear mode to catastrophic failure. For machines in critical service, sampling every 25 hours of operation is appropriate. For most industrial equipment in continuous service, however, monthly sampling is adequate. The exception to monthly sampling is machines with extreme loads. In this instance, weekly sampling is recommended.
Understanding Results:
Understanding the meaning of analysis results is perhaps the most serious limiting factor. Results are usually expressed in terms that are totally alien to plant engineers or technicians. Therefore, it’s difficult for them to understand the true meaning, in terms of oil or machine condition. A good background in quantitative and qualitative chemistry is beneficial. At a minimum, plant staff will require training in basic chemistry and specific instruction on interpreting tribology results.
VISUAL INSPECTIONS
Visual inspection was the first method used for predictive maintenance. Almost from the beginning of the Industrial Revolution, maintenance technicians performed daily "walkdowns" of critical production and manufacturing systems in an attempt to identify potential failures or maintenance-related problems that could impact reliability, product quality, and production costs. A visual inspection is still a viable predictive maintenance tool and should be included in all total-plant maintenance management programs.
ULTRASONICS
Ultrasonics, like vibration analysis, is a subset of noise analysis. The only difference in the two techniques is the frequency band they monitor. In the case of vibration analysis, the monitored range is between 1 Hertz (Hz) and 30,000Hz; ultrasonics monitors noise frequencies above 30,000Hz. These higher frequencies are useful for select applications, such as detecting leaks that generally create high-frequency noise caused by the expansion or compression of air, gases, or liquids as they flow through the orifice, or a leak in either pressure or vacuum vessels. These higher frequencies are also useful in measuring the ambient noise levels in various areas of the plant.
As it’s being applied as part of a predictive maintenance program, many companies are attempting to replace what is perceived as an expensive tool (i.e., vibration analysis) with ultrasonics. For example, many plants are using ultrasonic meters to monitor the health of rolling-element bearings in the belief that this technology will provide accurate results. Unfortunately, this perception is invalid. Because this technology is limited to a broadband (i.e., 30 kHz to 1MHz), ultrasonics does not provide the ability to diagnosis incipient bearing or machine problems. It certainly cannot define the root cause of abnormal noise levels generated by either bearings or other machine-train components.
As part of a comprehensive predictive maintenance program, ultrasonics should be limited to the detection of abnormally high ambient noise levels and leaks. Attempting to replace vibration monitoring with ultrasonics simply won’t work.
OTHER TECHNIQUES
Numerous other nondestructive techniques can be used to identify incipient problems in plant equipment or systems; however, these techniques either don’t provide a broad enough application or are too expensive to support a predictive maintenance program.
Therefore, these techniques are used as the means of confirming failure modes identified by the predictive maintenance techniques discussed in this section.
Electrical Testing
Traditional electrical testing methods must be used in conjunction with vibration analysis to prevent premature failure of electric motors. These tests should include:
• Resistance testing
• Megger testing
• HiPot testing
• Impedance testing
• Other techniques
.Resistance Testing:
Resistance is measured by using an ohmmeter. In reality, an ohmmeter does not directly measure resistance; it measures current instead. The scale of the meter is calibrated in ohms, but the meter movement responds to current. The amount of current supplied by the meter is very low, typically in the rage of 20 to 50 microamperes. The meter functions by applying its terminal voltage to the test subject and measuring the current in the circuit.
For practical purposes, although resistance testing is of limited value, some useful tests may be performed. A resistance test will indicate an open or closed circuit. This can tell us whether there is a break in a circuit or if there is a dead short to ground.
It’s important to remember that inductive and capacitive elements in the circuit will distort the resistance measurements. Capacitive elements will appear initially as a short circuit and begin to open as they charge. They will appear as open circuits when they are fully charged. Inductive elements will appear initially as open circuits, and the resistance will decrease as they charge. In both cases, the actual charging time is tied to the actual resistance, capacitance, and inductance in the circuit in question. It still requires five time constants to charge capacitors and inductors. It’s also important to remember that when disconnecting the meter from the circuit that there are now charged capacitive and inductive elements present, so due caution must be observed when disconnecting the test equipment.
Resistance testing is of limited value for testing coils. It will detect an open coil, or a coil shorted to ground. Resistance testing will most often not detect windings that are shorted together or weak insulation.
Megger Testing:
In order to measure high resistances, a device known as a mega-ohmmeter can be used. This instrument differs from a normal ohmmeter in that instead of measuring current to determine resistance, it measures voltage. This mode of testing involves applying relatively high voltage (500 to 2,500 volts, depending on the unit) to the circuit and verifying that no breakdown is present. Generally, this is considered a non destructive test, depending on the applied voltage and the rating of the insulation. This method of testing is used primarily to test the integrity of insulation. It won’t detect shorts between windings, but it can detect higher-voltage-related problems with respect to ground.
HiPot Testing:
HiPot (high potential) testing is a potentially destructive test used to determine the integrity of insulation. Voltage levels employed in this type of test are twice the rated voltage plus 1,000 volts. This method is used primarily by some equipment manufacturers and rebuilding facilities as a quality assurance tool. It’s important to note that HiPot testing does some damage to insulation every time it’s performed. HiPot testing can destroy insulation that is still serviceable, so this test is generally not recommended for field use.
Impedance Testing:
Impedance has two components: a real (or resistive) component and a reactive (inductive or capacitive) component. This method of testing is useful because it can detect significant shorting in coils, either between turns or to ground. No other nonintrusive method exists to detect a coil that is shorted between turns.
Other Techniques:
Other techniques that can support predictive maintenance include acoustic emissions, eddy-current, magnetic particle, residual stress, and most of the traditional nondestructive methods. If you need specific information on the techniques that are avail able, the American Society of Nondestructive Testing (ANST) has published a complete set of handbooks that provide a comprehensive database for most nondestructive testing techniques.