AMAZON multi-meters discounts AMAZON oscilloscope discounts
cont from part 1
ELEVATOR SELECTION
28. GENERAL CONSIDERATIONS
The selection of elevators for any but the simplest buildings requires the simultaneous consideration of several factors: adequate elevator service for the intended building usage, economics, and the architectural integration of spaces assigned to elevators, including lobbies, shafts, and machine rooms. In large buildings, many combinations are possible because these factors are interdependent. The selection of an optimum system for such buildings is most practical and accurate with the aid of a computer or simulator, and their use has become standard practice in the industry. Hand computation, following certain guidelines, can yield good results for small, straightforward buildings and reliable preliminary data for almost all buildings.
The design criteria usually used in determining elevator service quality are:
• Interval and average waiting time
• Handling capacity
• Travel time
The elevator system selection process, either by hand or computer, involves matching these three criteria with estimated performance values. Design intent (for example, acceptable service or excellent service) will inform the choice of numeric values for the criteria.
29. DEFINITIONS
A definition of important terms, including variant usages, follows.
Average lobby time or average lobby waiting time. The average time spent by a passenger between arriving in the lobby and leaving the lobby in a car. This is a key selection criterion.
Handling capacity (HC). The maximum number of passengers that can be handled in a time given period-usually 5 minutes, thus the term 5-minute handling capacity. When expressed as a percentage of the building's population, it is called percent handling capacity (PHC). This is a key selection criterion.
Interval (I) or lobby dispatch time. The aver age time between departures of cars from the lobby.
Registration time. Waiting time at an upper floor after a call is registered.
Round-trip time (RT). The average time required for a car to make a round trip-starting from the lower terminal and returning to it. The time includes a statistically determined number of upper-floor stops in one direction and, when calculating elevator requirements based on up-peak traffic, an express return trip.
Travel time or average trip time (AVTRP). The average time spent by passengers from the moment they arrive in the lobby to the moment they leave the car at an upper floor. This is a key selection criterion.
Zone. A group of floors in a building that is considered as a unit with respect to elevator service.
It may consist of a physical entity-a group of upper floors above and below which are blind shafts-or it may be a product of the elevator group control system, changing with system needs.
TABLE 4 Recommended Elevator Intervals and Related a Lobby Waiting Time
30. INTERVAL OR LOBBY DISPATCH TIME AND AVERAGE LOBBY WAITING TIME
In an ideal installation, at least from the riding public's point of view, a car would be waiting at the lower terminal on the rider's arrival or would be available after a short wait. Because cars leave the lobby separated in time by the interval (I) and passengers arrive at the lobby in random fashion, the average waiting time in the lobby should be half (50%) the interval. Field measurements show, how ever, that it is actually longer than this. The figure most often used in the industry is 60%-that is, average lobby waiting time = 0.6 × I
TABLE 4 lists intervals and suggested values for office buildings and the related average waiting time based on the foregoing relationship. Because some control systems zone the building in such a way that some cars do not return to the lobby, the interval as a figure of merit may be somewhat mis leading in such buildings. The table also lists recommended intervals for other types of buildings.
With intervals in the recommended range, riders are not conscious of any irksome delay in elevator service. Consciousness of delay is considered a major drawback in rental desirability and should be avoided for all traffic conditions except morning and evening peaks, when a certain delay is expected and therefore tolerated, however grudgingly. Even in peak periods, any modern group supervisory system will recognize a timed-out call-that is, a call with a registration time exceeding 50 seconds-as a priority call. Priority calls are answered by the first available car, usually within 15 seconds. If a considerable amount of interfloor traffic is expected during peak periods, as may be the case when a large company occupies several upper floors, elevator capacity should be increased by 20% to 40% over the capacity otherwise calculated to maintain proper intervals.
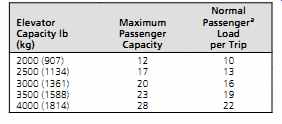
TABLE 5 Car Passenger Capacity (p)
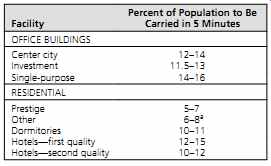
TABLE 6 Minimum Percent Handling Capacities (PHC)
31. HANDLING CAPACITY
The frequency, or interval, with which a car appears at the main building lobby is one of the two factors that determine the passenger capacity of an elevator system. The other is the size of the elevator car. The system's handling capacity is completely determined by these two factors-car size and interval-and is independent of the number of cars. This can be best understood by visualizing an elevator system as a single set of doors that opens periodically (the interval) to remove a given number of passengers (the car capacity) from a patiently waiting group of would-be passengers. Whether the set of doors represents a single car or many cars that take turns is immaterial. The only factors that determine the handling capacity are passenger load (car capacity) and frequency of loading (interval) (TABLE 5).
Recognition is taken of the fact that during peak traffic periods, cars are not loaded to maxi mum capacity but typically only to about 80%-a figure determined by actual count in many existing installations.
As a convenient measure of capacity, the handling capacity of a system for 5 minutes is taken as a standard. This is because a 5-minute rush period is historically used as a measure of a system's ability to handle traffic. This may be expressed thus:
handling capacity (HC) = passengers/car
× cars/sec × 5 min
× 60 sec/min
Because the number of cars per second is the reciprocal of the interval (e.g., 30 seconds between cars is the same as 130th of a car per second), this equation reduces to HC =
× passengers /car interval 300 or HC p I = 300, where p is car loading (number of passengers/car). When the interval is 30 seconds, the system's handling capacity is 10p, a convenient figure to remember.
To establish a figure of merit for building service, system HC must be related to building size. This is normally done by establishing the minimum percentage of the building population that the system must handle in 5 minutes, called PHC. A good system for a diversified office building will handle no less than 12% of the building population. Similar values are shown in TABLE 6 for various types of facilities.
In planning a building's elevator requirements, its population must be estimated. This is particularly difficult in speculative-type, diversified-use buildings. However, based on rental cost, area, and building type, a fair estimate can be made. Population estimates for office buildings are based upon net area-that is, actual available area for tenancy.
TABLE 7 gives suggested density figures, and TABLE 8 gives average office building efficiency values for use in calculating net area.
TABLE 7 Population of Typical Buildings for Estimating Elevator and Escalator Requirements
TABLE 8 Office Building Efficiency
32. TRAVEL TIME OR AVERAGE TRIP TIME
The average trip time (or time to destination) is the sum of the lobby waiting time plus travel time to a median floor stop. Car round-trip time is also used as a performance criterion, but it is not as meaningful as trip time. In a commercial building context, a trip of less than 1 minute is highly desirable, a 75-second trip is acceptable, a 90-second trip is annoying, and a 120-second trip is the limit of toleration. In the more relaxed atmosphere of a residence, where interval alone can account for a minute or more of trip time, these maxima are revised upward.
Figure 20 shows that the 2000- and 2500-lb (907- and 1134-kg) cars used in residential buildings can have a 17-story rise, even with a 60-second interval, without excessive trip time. The 3500-lb (1588-kg) car, however, which is almost universally used in office buildings ( FIG. 21), is limited to a maximum 16-floor local run before exceeding the 90-second limit and to about 6 to 8 floors to stay within the 75-second criterion.
An important reservation on the foregoing statements must be noted. The curves of Figs. 20 and 21 are based upon statistical calculations, empirical data, and field observations, as discussed in the next section. This being so, the average values that these curves give should be considered to be +/- 15% accurate, and borderline cases can be shifted either way. Designs that show high travel time on paper frequently work out well in the field, because lobby loading is often less than 80%, upper floor stops take less than the statistically predicted time due to groups of people going to the same floor, and staggered working hours relieve traffic peaks.
Also, a feature called high-call reversal takes account l of the fact that cars do not travel to the top of the shaft on each trip, but reverse at the topmost call.
This can reduce the average trip time by 5% to 10%. Finally, sophisticated solid-state traffic controls allow for rapid acceleration and deceleration without discomfort, variable door-closing time, and very efficient selection of landing call responses, all of which can further reduce the trip time by another 5%.
FIG. 20 Plots of average trip time for various car speeds and capacities with a 9-ft, 6-in. (2.9-m) floor height and a 30-second interval.
FIG. 21 Plots of average trip time for various car speeds and capacities for a 12-ft (3.7-m) floor height and a 30-second interval.
FIG. 22 Plots of round-trip time for various car speeds and capacities with a 9-ft, 6-in. (2.9-m) floor height and a 30-second interval.
FIG. 23 Plots of round-trip time for various car speeds and capacities with a 12-ft floor (3.7-m) height and a 30-second interval.
FIG. 24 One-way express running time, not including terminal time; (a) low-speed cars, (b) high-speed cars.
33. ROUND-TRIP TIME
The value for round-trip time during up-peak traffic conditions, used for calculating elevator requirements, is composed of the sum of four factors: (1) time to accelerate and decelerate, (2) time to open and close doors at all stops, (3) time to load and unload, and (4) running time (Figs. 22 to 24). Physically, round-trip time is the time from door opening at the lower terminal to door opening at the same terminal at the end of a round trip. Because the actual number of stops made by a car is unknown, a statistical probability value is used, based upon the passenger capacity of the car and the number of local floors above the lower terminal. In calculating this round-trip time (RT), it is assumed that a car will depart the lower terminal when loaded. No intentional delay is included at either the lower or upper terminal. The RT thus calculated is a T median figure, with any single actual round trip taking more or less time. In detail, RT consists of T the time expended in
1. Loading at the lobby
2. Door closing at the lobby
3. Accelerating from the terminal and from each stop
4. Decelerating at each stop
5. Passenger transfer at each stop
6. Door operations at each stop
7. Running time at rated speed between stops
8. Return express run from the last stop
These figures are obtained as follows:
1. Field observations: Items 1 and 5 are based upon a 3-ft, 6-in. (1.07-m) door opening. A smaller door opening increases passenger transfer time.
2. Calculations: Items 2, 3, 4, 6, 7, and 8. Door closing time is based on a 3-ft, 6-in. (1.07-m) center-opening door with adjustable speed.
Acceleration and deceleration times are calculated with a maximum of 4 ft/s/s (1.2 m/s/s) because any thing beyond that results in physical discomfort to the passengers. Running time at rated speed takes place after the car has accelerated and before it begins to decelerate. Considering that it takes between 20 and 30 ft (6 to 9 m) to accelerate to 700 fpm (3.6 m/s), depending upon the rate of acceleration, in local runs a car never gets to the rated speed. It simply accelerates and decelerates. Higher-speed equipment with a larger motor accelerates more quickly and gives some time advantage on the return express run, but it has no great time advantage overall. This accounts for the small reduction above 500 fpm (2.5 m/s) seen in Figs. 22 and 23.
In calculating RT for cars in upper zones, it is necessary to know the time required to traverse the express floors. This may be obtained from FIG. 24.
The times given there are for one-way express runs.
Thus, to calculate RT for an upper-zone car, take the RT corresponding to the upper local floors and add twice the figure obtained for express run time from FIG. 24.
34. SYSTEM RELATIONSHIPS
The symbols that will be used in describing elevator calculations are:
========
p individual car capacity, equal to 80% of the maximum during peak hours h 5-minute capacity of a single car N number of cars in a system HC system 5-minute handling capacity, expressed in number of persons RT round-trip time, in seconds AVTRP average trip time, in seconds I interval, in seconds D population density, in square feet (m2) per person PHC percent of the population to be moved in 5 minutes, and expressed as a percentage
========
Now that the definitions of interval, handling capacity, average trip time, and round-trip time have been presented, the interrelationships among these quantities can be demonstrated, along with other equations governing the remaining factors that define elevator systems.
Handling capacity HC is determined by car capacity p and interval I:
HC p I = 300
(eqn. 1)
In a system consisting of a single car, the interval (I) is equal to the round-trip time (RT). In a system with more than one car, the interval is reduced in proportion to the number of cars. Thus,
I= RT N (eqn. 2)
The 5-minute handling capacity (h) of a single car is then
h= p RT 300 (eqn. 3)
...remembering that for a single car, its interval is its round-trip time. It follows that if the handling capacity of a single car is h, then the handling capacity of N cars is N times as much. Thus, HC = N × h
or
N HC h
= (eqn. 4)
35. CAR SPEED
The selection of car speed to be used is a matter of trial and error, the final selection being that required to give an RT that in turn gives an acceptable interval. In order to establish a starting point, however, it has been found that a minimum car speed corresponding to a given building height-or, in elevator parlance, rise- can be established. Similarly, although car size can be selected at any value, it has been shown that for certain facility types, specific-size cars are indicated. These recommendations are given in TABLE 9.
TABLE 9 Elevator Equipment Recommendations
Bear in mind that elevator equipment falls into distinct speed categories. Thus, most manufacturers use geared equipment through 400 fpm (2 m/s) and gearless equipment thereafter.
The next category is 500 fpm (2.5 m/s) gearless followed by 600 fpm (3.0 m/s) to 700 fpm (3.6 m/s), and so on. It is wise to avoid moving into the next higher-and more expensive-equipment category if possible. This may mean exceeding the recommended interval or dropping slightly below desired handling capacity. It will be found, how ever, that this can usually be done without injury to the elevator system performance, provided that a quality group supervisory control system is employed.
36. SINGLE-ZONE SYSTEMS
Having established the relationships that govern the design and performance of an elevator system comprising a single zone, it would be helpful to follow through an illustrative example.
EXAMPLE 31.1 Office building, downtown, diversified use, 14 rentable floors above the lobby, each 12,000 ft 2 (1115 m2) net. Floor-to-floor height- 12 ft (3.7 m). Determine a workable elevator system arrangement.
SOLUTION
From TABLE 6, recommended average HC is 13%. C From TABLE 4, the maximum recommended interval is 25 seconds. From TABLE 7, average population density is 120 ft 2 (11 m2) per person.
Trial 1 Building population:
14 floorsat 12 000 ft 120 ft per person 1400 pers 2 2 ,
= ons o o (14 at 1115/11 ˜ 1400 persons) Suggested minimum handling capacity:
PHC = 13%
HC = 0.13 × 1400 = 182 persons
rise = 14 floors at 12 ft (3.7 m) = 168 ft (51 m)
From TABLE 9, select a car size of 3500 lb (1588 kg) at 500 fpm (2.5 m/s).
3500 lb (1588 kg) 500 fpm (2.5 m/s) Then, from Figs. 23c and 21 c c:
RT = 155 seconds AVTRP = 82 seconds
[....]
As expected, improvement over the performance at 500 fpm (2.5 m/s) is very slight: an interval of 28 seconds rather than 28.4 seconds and a handling capacity of 12.3% versus 12%. The large increase in first cost for gearless equipment would not be justified.
At this point, the final selection would be made on the basis of cost. When considering cost, note that first cost is the governing factor only in a speculative venture. With an owner-operator building, the cost comparison should be on a life-cycle basis.
Cost figures must reflect the impact of elevator space requirements on net rentable area in the building.
Comparative cost figures are given in TABLE 10.
As mentioned earlier and shown in FIG. 17, planners of new buildings today generally take advantage of elevator selection software provided by consultants, by manufacturers, or via in-house capabilities. The results from one such program are shown in FIG. 25 (this particular analysis was prepared by Otis Elevator Co.). Note that projected system performance under a variety of operational and functional scenarios can be quickly evaluated and compared.
This agreement is not surprising because the round-trip curves in FIG. 23 are based on a 3.3-second door time and a 4.0 ft/s^2 (1.2 m/s^2) car acceleration, as shown in the figure. Note that high call reversal occurs at the top floor (13.5, i.e., 14) and that the number of up stops is 10 (9.7 from statistical calculations). The up-peak calculation assumes no counter-flow traffic (i.e., an express down run and no interfloor traffic), as shown. These can be added, however, yielding very different results, as shown in FIG. 25. Counterflow traffic (down stops) of only 2% and interfloor traffic of 1%, both of which are reasonable values, change the round trip time substantially and reduce the handling capacity appreciably.
TABLE 10 Relative First Costa Figures for Passenger Elevators of Various Speeds and Drive Systems
FIG. 25 Printouts from a computerized elevator selection program. This analysis shows that the addition of even light counterflow and interfloor traffic can seriously affect system performance, as can be seen from the round-trip, interval, and handling capacity figures. (Courtesy of Otis Elevator Co.)
37. MULTIZONE SYSTEMS
In general, buildings with fewer than 15 stories are elevatored with a single zone (i.e., all cars serve all floors), and buildings with more than 20 stories are split into two or more zones. Buildings in between these limits-16 to 19 stories-can go either way, depending upon the population density and the required interval. A modern group supervisory system can automatically zone a building when traffic requires it. Such an arrangement, although efficient, is expensive in terms of both equipment and construction because it does not take advantage of the considerable savings engendered by blind lower shaftways for upper-zone elevators. Analysis of multizone systems is complex and today is rarely done by hand. See Stein et al. (1986) for a detailed explanation of the technique involved. Most designers and consultants use one of many available computerized simulation and selection programs. These have the advantage that, in addition to using basic criteria and building parameters, they can also consider the effect of variations in traffic control.
Furthermore, the best of these programs can evaluate the engineering and economic impacts of such factors as varying rental rates for different floors, rental space, machine room and hoistway space, core layout, and the structural ramifications of the elevator system.
38. ELEVATOR SELECTION FOR SPECIFIC OCCUPANCIES
(a) Office Buildings
Necessary design criteria can be selected from Tables 4 to 7. Supervisory group control is normally microprocessor-based. Approximately 1 service car per 10 passenger cars should be provided or, alternatively, one service car for every 300,000 ft 2 (27,870 m2) of net area. Service cars should be 5000 lb (2268 kg) or larger without a dropped ceiling and, if also used for passenger service, equipped with wall pads. An oversized door (e.g., 4 ft, 0 in. [1.2 m] or 4 ft, 6 in. [1.4 m]) is particularly useful in handling furniture. Service elevators should have a shaftway door at every level plus easy access to the truck dock (or other freight entrance) as well as the lobby.
These cars operate as service cars normally but can serve as passenger cars in peak periods to reduce congestion and delay. This fact is particularly useful in marginal service designs. See TABLE 11 for approximate building costs.
(b) Apartment Buildings
Studies indicate that apartment building traffic depends not only upon the population but also on the location and type of tenant. Buildings with many children experience a school-hour peak; buildings in midtown with predominantly adult tenancy exhibit evening peaks due to the homecoming working group and outgoing dinner traffic. Where two cars are required, the second car should function both as a service car and as a passenger car. The cars may be banked or separated, as desired. If a single car is used, it should be of service elevator size.
Self-service collective control is the general choice, with provision for attendant control in prestigious buildings. With small cars and a short rise, a swing-type manual corridor door is acceptable; in larger installations, both the car and the corridor door should be the power-operated sliding type.
Service elevators must be large enough to handle bulky furniture and should therefore be at least 4000 lb (1814 kg), with a 48-in. (1.2-m) door and a high ceiling. Hoistways must be isolated from sleeping rooms by lobbies or other space. Similarly, machine rooms must be isolated because the starting and stopping of motors and other machine room noises are a detriment to sound sleep. Security arrangements are discussed in Sections 47.
(c) Hospitals
As mentioned in TABLE 7, the governing factor in the determination of elevator requirements may be either normal hospital traffic or visitor traffic, depending upon the visiting-times schedule. Due to the large volume of vehicular traffic such as stretcher carts, wheelchairs, beds, linen carts, and laundry trucks, hospital elevator cars are much deeper than the normal passenger type. This type of car, when used for passenger service, holds more than 20 persons and therefore gives slow service.
For this reason, it is occasionally advisable to utilize some normal passenger cars in addition to hospital size cars, particularly in large hospitals.
The use of tray and bulk carts in food service imposes a considerable load upon the elevator system before, during, and after meals, and passenger service is seriously disrupted. To reduce this congestion and delay, many architects and hospital administrators prefer the use of dumbwaiter cars or another of the many types of materials handling systems that can handle a 15½ × 20 in. (394 × 508 mm) food tray. These systems can also be used for transporting pharmaceuticals and other items.
Elevators should be grouped centrally, although separated by type of use. Car control is normally self-service collective.
The population of a hospital may be estimated from TABLE 7. Experience has shown that a carrying capacity of 45 passengers in a 5-minute period is adequate (estimating each vehicle as equivalent to 9 passengers).
TABLE 11 Office Buildings: Cost of Elevator and Electric Work
Intervals should not exceed 1 minute. All recommendations for service to the handicapped should be adopted (see Sections 14).
(d) Retail Stores
Retail stores present a unique problem in vertical transportation inasmuch as the objective is partially to transport persons to specific levels and partially to expose the passengers (customers) to displayed merchandise. For this reason, modern stores rely heavily on escalators, with one or two elevators provided for use by staff and handicapped persons. When, for some reason, it is desired to equip a store exclusively with elevators, use the recommendations shown in TABLE 9, calculated for a load of 10% to 20% of the store's population. Control should be automatic, selective, and collective. Cars are arranged in a straight line to facilitate loading and waiting.
Prev. | Next
Home Similar
articles top
of page