AMAZON multi-meters discounts AMAZON oscilloscope discounts
(cont. from part 1)
6. PV SYSTEM BATTERIES
Batteries are required in a stand-alone system to store excess PV-produced electricity (from high production periods) for use during peak electricity consumption periods (the pattern illustrated in FIGR. 1). For residential installations, there is usually almost no coincidence between these two time periods because PV output peaks at solar noon, whereas residential usage peaks in the evening and is low at noon. In comparison, commercial stand-alone PV installations such as off-grid stores, shops, cottage industries, and the like have a much higher coincidence. This means that during normal, everyday use, the drain on the battery is shallow, and a cheaper battery will frequently suffice. These considerations are expanded in the system design discussions in Sections 8 and 9.
A PV system battery is usually expected to be capable of supplying most or all of an installation's electrical requirements for a given period-usually 3 days of cloudy weather if no other specific-use data are available. This means that the battery selected:
• Must be capable of repeated discharge to 20% capacity or less without injury
• Must be designed to accept slow, lengthy recharge
In addition, the battery:
• Should have long life
• Should be suitable for the physical conditions in which it will be used (i.e., space, ambient tempera ture, ventilation, and maintenance availability)
Pure lead automobile batteries (also known as lead-acid batteries) are not suitable for PV systems because they are designed for rapid, shallow discharge (engine starting) and very rapid recharge.
If such a battery is repeatedly discharged more than about 20% (shallow discharge), or if it is not completely recharged after discharge, its life will be extremely short. Batteries made for use in electric vehicles such as golf carts and fork lifts are constructed with heavy plates and are designed for the deep-cycle discharge needed in PV systems. Most of these are flooded batteries, meaning that the plates must be completely covered with electrolyte to prevent damage. This requires frequent maintenance, making flooded batteries unsuitable for unattended sites.
Lead-calcium batteries are almost maintenance-free, rarely requiring addition of water or electrolyte. As a result, they are frequently used in unattended systems. They do not cycle as deeply as heavy-plate, deep-cycle units, and this must be considered during design.
Sealed batteries are completely maintenance free. They are frequently constructed with a gel-type electrolyte that does not "boil" off on recharge and therefore needs no replacement. This makes them ideal for unattended sites, provided that they are specifically designed for deep-cycle service (80% discharge) and are so labeled. Most maintenance-free batteries are shallow-cycle units and therefore are unsuitable. An important characteristic of sealed units is that they require very accurate charge and discharge control to prevent overcharge or overdischarge, or over-rapid charge or discharge. Any of these conditions severely shortens battery life. As a result, gel-cell batteries require the use of a high quality charge controller.
Lead-antimony batteries are very sturdy and tolerate deep discharge and slow or rapid charge while maintaining their rated life. They require occasional water replenishment and adequate ventilation to disperse gases created during charging cycles.
Nickel-cadmium batteries are highly desirable in PV systems because they are maintenance-free, can be discharged to essentially 100% of capacity without injury or shortening of life, are much less temperature-sensitive than lead-acid batteries, and have a longer life. Their principal drawback is their high price. Nickel-cadmium batteries should not be shallow discharged because they tend to develop a "memory" of the discharge cycle and after many shallow cycles may not supply sufficient cur rent for a deep discharge. Therefore, in essentially clear-sky climates, where a 3-day period of cloudiness is rare, nickel-cadmium batteries may not be applicable because storage sized for a 3-day system supply would normally be operating on shallow discharge.
Additional considerations in battery selection include:
Temperature. Lead-acid battery capacity declines with temperature. Nominal battery capacity ratings are referenced to a temperature of 77ºF (25ºC). Batteries operating at lower temperatures should be derated (in the absence of specific manufacturer's recommendations) as follows:
Ambient Temperature | Derating Factor
|
|
It is important to note that a discharged lead-acid battery contains essentially water and therefore freezes at about 30ºF (-1ºC). A fully charged battery will not freeze until the temperature dips below 0ºF (-18ºC). Nickel-cadmium batteries are much less affected by temperature.
Voltage. Battery terminal voltage varies with its state of charge, ranging for a 12-V battery at 77ºF (25ºC) from approximately 15 V at full charge to just over 12 V immediately after a deep discharge.
If the battery is not charged immediately, voltage drops to a low of slightly over 11 V.
Life. A properly maintained deep-cycle lead acid battery should last for a minimum of 5 years.
A nickel-cadmium battery should last 1.5 to 2 times as long.
Rating. The manufacturer's stated ampere hour (A-H) rating of a battery refers to a single continuous low-rate discharge under laboratory conditions. The actual field-use A-H capacity of a battery depends heavily upon the discharge rate, and it is this figure, as calculated for the particular installation, that should be used to compare batteries of the same type. All reputable manufacturers have readily available discharge curves that show voltage and duration at different discharge rates.
The basic storage battery is rated at 12 V, although 6-V units are available. Figure 11 shows typical battery connection arrangements for the most common system voltages, which are 12, 24, 48, and 72 V. Table 1 shows some typical physical data for batteries.
7. BALANCE OF SYSTEM
The balance of system (BOS) consists of a charge controller, inverter if used, and accessories such as blocking diodes, a lightning arrester, an electrical grounding system, and other electrical specialty items. Refer to Figs. 7 through 9 for a sense of how these components fit into a PV system.
Although they are important to overall system performance and safety, a full description of these items is beyond the scope of this section. Refer to the references at the end of this section for a few of the many excellent resources that address these components.
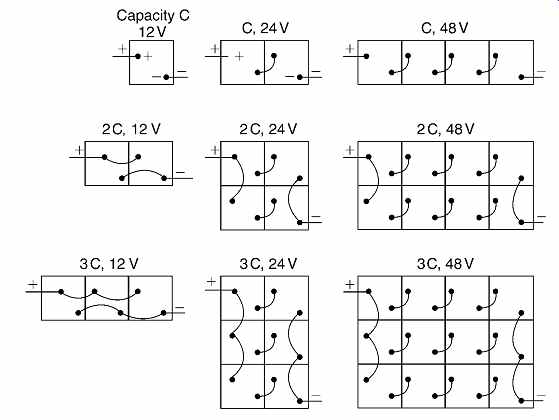
FIGR. 11 Wiring arrangements for 12-V battery packs to obtain increased capacity,
increased voltage, or both.
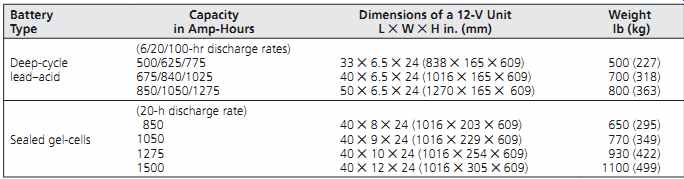
TABLE 1 Physical Characteristics of Typical 12-Va Batteries
8. DESIGN OF A STAND-ALONE PV SYSTEM
There is a fundamental difference in the procedures for array sizing and system arrangement between a stand-alone system and a grid-connected PV system. A stand-alone system must supply the entire electric load; there is no utility backup. Design decisions are primarily technical. A grid-connected system may supply part, or all, of the electric load.
Design decisions are influenced by economics and owner intent, within the context of technical feasibility. These two procedures are addressed separately in this and the following section.
Figure 7 shows the essentials of a stand alone PV system. Because building electricity demands rarely exactly match the output of a PV system, the system operates successfully by using a PV array to charge a battery, which then sup plies the building load. Any occasional coincidence between load and PV production is incidental to the design process. The three factors that establish the system requirements are:
• The daily electricity usage
• The period of time for which the battery must supply the electric load without recharge
• The available insolation
The first factor is a function of building design.
The second factor is a function of local weather conditions and would most often be chosen as the number of successive solid overcast or rainy days usually encountered. Designing for highly unusual weather results in a system that is over sized for normal (say, 95th percentile) weather patterns and, therefore, is essentially uneconomical. That scenario weighs heavily in favor of a hybrid system (see FIGR. 8), which defeats, at least in part, the environmental benefits of the PV system.
The PV system design procedure is essentially straightforward and is as follows:
STEP 1. Determine the average daily energy usage in watt-hours.
STEP 2. Determine the maximum period for which the system battery must supply the entire electrical load. (In practice, this requirement can be reduced by switching off nonessential loads during unusually long sunless periods.)
STEP 3. Determine the required system battery capacity, which is equal to the daily load (Step 1) multiplied by the number of days that the battery must supply the load (Step 2). System losses are taken into account in this calculation.
STEP 4. Determine the preliminary size of the PV array. The array must supply all of the required electricity, that is, the facility's daily requirements (Step 1) plus all system losses. The preliminary array size is this capacity in terms of watt-hours.
To determine the physical size of the array, the designer must determine the number of watt hours produced per unit area of PV module. This involves knowledge of the site's solar radiation, the type and efficiency of the PV module used, mounting approach (stationary or tracking), and tilt angle (module angle measured from the horizontal). With these data in hand, the area of PV array required is simply the total load in watt-hours divided by the PV unit's energy production in watt hours per unit area.
STEP 5. Check that the array selected is sufficiently large to charge the battery capacity established in Step 3. Assuming, for instance, a 3-day period during which the battery must supply the entire load, about 3½ consecutive sunny days at the same insolation will be needed for full recharge (considering losses of approximately 20%). If the facility is to be used year-round and the PV array is sized on the basis of summer insolation, it is necessary to do a calculation for a winter month as well. Insolation data are usually available for both seasons, and average monthly insolation accounts for the appreciable energy available from cloudy skies as well as sunny skies. The result generally indicates a larger PV array requirement for winter months. In such cases, on purely economic grounds, the decision is often to use a small engine generator for battery charging for winter use only. This is not the same as a hybrid system (FIGR. 8), in which the generator is used year-round to pick up heavy ac loads.
Some designers base the PV array size on minimum yearly (winter) insolation, reasoning that in other months any wasted overproduction from an array is the price paid for year-round operation without fossil fuels. Others use a median insolation figure, reasoning that power outages will be few and of short duration. Using summer insolation values will minimize the PV array size but probably will require inclusion of a small generator.
An illustrative example using the outlined design procedure should clarify the issues and calculations involved.
EXAMPLE 1 Design a stand-alone PV system for a 650-ft 2 (60-m2) occupied-year-round, off-line cottage located near Prescott, Arizona. In addition to the usual appliances, an evaporative cooler is used during hot summer days. A PV array can be mounted on the south-facing sloping roof at any required angle.
Determine the required battery and PV array sizes.
State all assumptions.
SOLUTION
STEP 1. Determine the average electric energy consumption for the cottage. Although refrigerators that run on bottled gas are readily available, assume use of an electric refrigerator. Water heating is solar thermal, with a small gas booster heater. Cooking is with bottled gas.
STEP 2. Assume that investigation of local climate conditions indicates occasional periods throughout the year, but primarily in the winter, of 2 to 3 consecutive days of heavy overcast, clouds, and rain.
STEP 3. Sizing the system battery. Assume use of a deep-cycle flooded-cell lead battery with an appropriate charge controller. These batteries can supply about 80% of their rated ampere-hour capacity. Since the battery will be located indoors, but in an unheated room, it should be derated 15% for ambient temperature for a conservative design. Required battery size in ampere-hours equals:
3 days 200 A-Hdaily load 1.20 discharg ×× e efactor
0.85 (temperature derating) 850 A- = H
One type of 850-A-H, 24-V deep-cycle lead-acid battery (using two at 12-V units in series) measures approximately 40 in. long × 15 in. wide × 24 in. high (1020 mm × 380 mm × 610 mm) and weighs about 1500 lb (680 kg).
STEP 4. Sizing the PV array. Because the cottage will be occupied all year, and because the critical performance period is winter, when the sun is low, select a tilt of (latitude +15º) to maximize winter PV production. As the array is roof-mounted and will be relatively large, use a stationary rather than a tracking array. The array must supply the daily energy requirement of 4783 Wh or 4.8 kWh.
Referring to FIGR. 12, which gives solar radiation data for the Prescott location, obtain the following data: average solar radiation for a PV array facing south at a tilt angle of latitude +15º:
January: 5.5 kWh/m^2/day; average monthly temperature 2.3ºC (0.51 kWh/ft 2/day; 36ºF) June: 6.0 kWh/m^2/day; average monthly temperature 19.6ºC (0.56 kWh/ft 2/day; 67ºF) Figure 29.13 was drawn using the computer program PVFORM, developed at Sandia National Laboratories. It gives daily average PV array production in Wh/ft^2 as a function of monthly aver age temperature and monthly average solar radiation in kWh/m2/day. Using the January and June radiation figures stated previously, obtain from FIGR. 13: January: 52 Wh/ft 2 of a PV array (560 Wh/m^2) June: 53 Wh/ft^2 of a PV array (570 Wh/m^2)
The PV array output is essentially constant through out the year (with radiation availability and ambient temperature effects offsetting), and no difficulty will be encountered in an "off" season. If the PV modules to be used have an efficiency greater than 10%, then the array output would be increased proportionately.
The required area of PV array, assuming 10% conversion efficiency, is:
PV area = (4783 Wh/day required) / (52 Wh/day/ft^2 output) = 91 ft 2 (8.5 m^2)
STEP 5. Because the solar radiation in Prescott, Arizona, is essentially identical for summer and winter, PV production in 3 to 3½ clear days will fully recharge the battery, as explained previously.
Summary. The suggested PV system consists of approximately 90 ft 2 (8.4 m^2) of PV collector, an 850-A-H, 24-V battery, and a 1500-W inverter to handle the initial load plus the anticipated addition of small ac appliances. The summer-only DC cooling loads will likely be offset in winter by additional use of lighting and television and other in-cottage activities.
Additional Considerations. Using accurate radiation and weather data for a site is necessary for the design of an efficient and workable system.
Unfortunately, accurate radiation data, particularly for tilted surfaces, are not always available, and tilted-surface data are not easily derived from horizontal-surface or normal-to-the-sun data. PV installations are frequently planned for sites out side of large cities, and it is usually for these areas that a paucity of data exists. In such instances, data for nearby areas can be used but must be applied judiciously, as insolation conditions can vary sharply within a relatively small geographic area.
FIGR. 12 Solar radiation data for Prescott, Arizona. (From Solar Radiation Data Manual, National Renewable Energy Laboratory, 1994.)
FIGR. 13 Daily average PV array production, Wh/ft^2, as a function of monthly average temperature and incident solar radiation. Production was calculated using PVFORM for a 10% efficient solar cell array at 77ºF (25ºC) ambient temperature. (Reprinted with permission from "Design for PV," Association of Collegiate Schools of Architecture.)
9. DESIGN OF A GRID-CONNECTED PV SYSTEM
The design procedure for an interactive system (with feedback into the utility grid; see FIGR. 9) differs from the typical stand-alone system design procedure described in Section 29.8. The principal differences are:
• The loads in an interactive system are all ac rather than a mix of ac and dc because the building is fed from the utility line or from the PV array dc-to-ac inverter; dc is not available to the loads.
• The existence of a PV system has no bearing on the choice of fuel for appliances. Therefore, for instance, whether to use gas or electric cooking is a matter of fuel availability, costs, and owner preferences.
• Loads are generally heavier in interactive systems because one cannot run out of electric power, as with a stand-alone system. As a result, an all-electric house or a heavily automated house can be a candidate for a PV system as much as any other building.
• Load data can be obtained for a specific design or from general utility-supplied data similar to those shown in Figs. 14 and 15.
• Inasmuch as no battery or control equipment is used, space allocation in the structure for PV related equipment is small, and system maintenance is minimal. Also, system life is equivalent to PV array life. Design note: Some areas in North America have recently been hit with uncharacteristic ice storms that have caused unexpected and relatively lengthy power outages. Some owners with grid-connected PV systems in these areas have added a small battery to their systems to meet their essential needs (lights, heating, computer use) through such outages.
Assuming a net-metering arrangement, there is no advantage to coincidence of building electrical loads and peak PV production. This is emphatically not the case where PV production buyback is based upon avoided costs. In such situations, careful scrutiny of the utility's rate schedule may yield cost-saving opportunities in matching loads to lower-rate time periods. For nonresidential buildings, careful consideration of future electric loads should be reflected in architectural planning for future (larger) PV arrays. In this connection, the possibility of using distributed arrays, as in FIGR. 10, should be studied.
The general design procedure for a grid-connected PV system is as follows:
STEP 1. Establish with the power company the metering arrangement to be used, both physical and financial. The utility can also generally supply reliable data on solar radiation, load patterns, PV array sizing and tracking feasibility, and other relevant design data.
STEP 2. Using a detailed cost analysis, determine the optimum size of the PV array in today's market.
Although this analysis will involve technical data, the decision on an optimum size is essentially economic-trading utility cost savings against additional first costs for the PV system within a feasibility window established by the owner. This economic feasibility window will likely be influenced by qualitative factors such as a desire to reduce dependence on the "grid," a desire to be more environmentally friendly, or a desire to use a PV system to obtain green building certification points. Sensitivity analysis can be incorporated into the economic analysis to suggest ranges of reasonable system sizes given estimated changes in economic variables such as utility rates, tax credits, or future PV array costs.
STEP 3. Using specific data or generalized information similar to that given in Figs. 14 and 15, determine the required performance characteristics and physical size of the PV array established in Step 2.
In sizing PV systems, the need to provide charge to discharged batteries while simultaneously providing power to building loads should be considered. A system sized just large enough to meet all loads under design conditions will generally not have sufficient output to recharge depleted batteries.

FIGR. 14 Typical residential electricity usage profiles based on a 1500-ft^2
(140-m^2) house. (Reprinted with permission from "Design for PV," Association
of Collegiate Schools of Architecture.)

FIGR. 15 Typical electric load profiles for nonresidential U.S. buildings.
(Reprinted with permission from "Design for PV," Association of Collegiate
Schools of Architecture.)
10. CODES AND STANDARDS
PV installations are electrical systems and therefore fall under the purview of NFPA 70, the National Electrical Code (NEC) published by the National Fire Protection Association. Article 690 of the NEC-"Solar Photovoltaic Systems"-is devoted specifically to such systems, and its requirements, plus those of applicable articles in the remainder of the NEC, must be observed in all areas where the NEC is mandated by local jurisdiction. In addition, for grid-connected systems, the specific requirements of the local utility must be followed, all equipment approved by them, and the final installation subject to their inspection.
Other codes and standards that contain important information and may be applicable if required by local authorities include (IEC = International Electrotechnical Commission; IEEE = Institute of Electrical and Electronics Engineers; UL = Under writers Laboratories): IEC 61194 Ed. 1.0 b:1992: Characteristic Parameters of Stand-Alone Photovoltaic (PV) Systems IEC 61727 Ed. 1.0 b:1995: Photovoltaic (PV) Systems-Characteristics of the Utility Interface IEC 61215-1993: Crystalline Silicon Terrestrial Photovoltaic (PV) Modules-Design Qualification and Type Approval IEC 61173 Ed. 1.0 b:1992: Overvoltage Protection for Photovoltaic (PV) Power Generating Systems IEC 61277 Ed. 1.0 B:1995: Terrestrial Photovoltaic (PV) Power Generating Systems-General and Guide IEC 61702 Ed. 1.0 b:1995: Rating of Direct Coupled Photovoltaic (PV) Pumping Systems IEEE 1013-2000: Recommended Practice for Sizing Lead-Acid Batteries for Photovoltaic (PV) Systems IEEE 937-2007: Recommended Practice for Installation and Maintenance of Lead-Acid Batteries for Photovoltaic (PV) Systems UL 1703-2002: Standard for Flat-Plate Photovoltaic Modules and Panels UL 1741-1999: Standard for Inverters, Converters, and Controllers and Interconnection System Equipment for Use with Distributed Energy Resources As with most standards, these are regularly updated; verification of the most current version is advised.
11. PV INSTALLATIONS
PV power appears to be one of the dominant trends of the future. PV and buildings are too logical a connection to not develop into the norm. Even today, with unfavorable economics, numerous notable examples of PV installations exist. Several interesting examples are presented here.
Example 1: PV integrated with solar hot water collectors (FIGR. 16). This is an interesting application that matches resource with need and obviates the need for storage of the PV system's energy production. The PV output drives a pump that circulates solar-heated water. The pump operates only when there is enough solar radiation to heat the water, which means there is also enough radiation to drive the pump via the PV module. No batteries or grid backup are required.
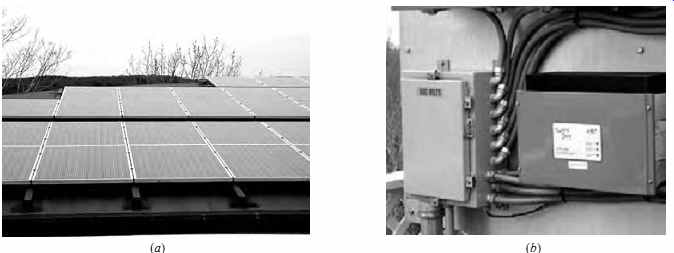
Example 2: An early example of BIPV (building-integrated photovoltaics). A Georgia Power demonstration house (FIGR. 17) in Atlanta that uses PV modules as the roofing (south-facing)
for the house. The replacement of redundant elements (such as separate PV and roofing layers) and integration of components are hallmarks of BIPV.
Example 3: Photovoltaics at the Woods Hole Research Center (FIGR. 18), Falmouth, Massachusetts. This green building features a substantial PV installation. The system is a net-metering arrangement (as described earlier). For further information, see the case study on this project presented in Section 1.
Example 4: PV on a solar racer (FIGR. 19), Australia, 1983. An early example of TIPV (transportation-integrated photovoltaics)? The lessons presented in this example actually apply well to buildings-reduce the load and optimize the collectors.
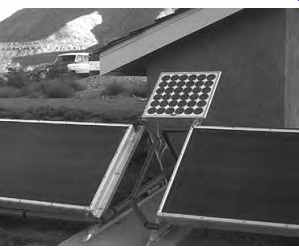
FIGR. 16 Synergistic PV application-pumping hot water produced by solar collectors
for a residence in the Southwestern United States. (Photo ©2004 by Walter Grondzik;
all rights reserved.)
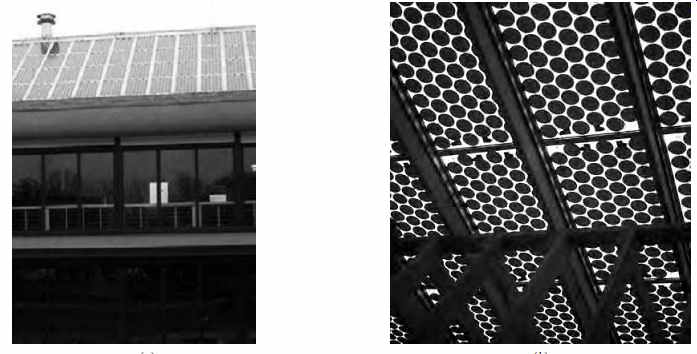
FIGR. 17 An early example of building-integrated PVs, Atlanta, Georgia. (a)
South façade of a residence with a PV array. (b) View of the roof from inside
the attic, thinking of the roof plane as a solar transformer rather than as
a solar barrier. (Photos © 2004 by Walter Grondzik; all rights reserved.)
FIGR. 18 PV at the Woods Hole Research Center, Falmouth, Massachusetts. (a)
Low-slope PV array on the roof of the building. (b) An inverter (one of several)
and a disconnect switch are also located on the roof. (Photos 2004 by Walter
Grondzik; all rights reserved.)
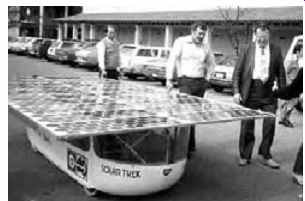
FIGR. 19 The PV car, a solar racer, after crossing Australia (not a minor
feat). (Photo 2004 by Walter Grondzik; all rights reserved.)
12. CASE STUDY-PV
Lillis Business Complex, the University of Oregon
PROJECT BASICS
• Location: Eugene, Oregon
• Latitude: 44.1 N; longitude: 123.2 W; elevation: 425 ft (130 m) above sea level
• Heating degree days: 4546 base 65ºF (2528 base 18.3ºC); cooling degree days: 300 base 65ºF (167 base 18.3ºC); annual precipitation: 43 in. (1092 mm); cloud cover: 75 clear days a year, 82 partly cloudy, and 209 cloudy
• Building type: Institutional-classrooms, offices, common areas
• 196,500 ft 2 (18,255 m2); four occupied stories
• Completed October 2003
• Client: University of Oregon
• Design team: SRG Partnership with Solar Design Associates (PV) and consultants
Background. The Lillis Business Complex is a new academic facility situated adjacent to a major circulation axis on the University of Oregon campus in Eugene. The building has the size, character, and location to serve as a teaching tool for thou sands of students who walk by on any given day.
North American universities as a rule (with notable exceptions) have not been in the forefront of the green design movement. This project is one of the exceptions.

FIGR. 20 South façade of the Lillis Business Complex, Eugene, Oregon. The
atrium glazing incorporates PV cells in a recent example of building-integrated
PVs. (Photo © 2004 by Alison Kwok; all rights reserved.) FIGR. 21 Glazing panel
on the Lillis Business Complex showing embedded PV cells. The glazing essentially
acts as a power plant while still providing for views and daylighting. (Photo
© 2004 by Alison Kwok; all rights reserved.)
Context. The Lillis Business Complex is an example of what can happen when various positive forces come into alignment on a project. In this case, an aware client seeking innovation partnered with a local utility promoting the use of alternative energy sources on a campus with an active Energy Studies in Buildings Laboratory (ESBL). The resulting synergy enabled this project to evolve into its final form without too much compromising of objectives. Utility support for the PV system was critical to its inclusion in the project; the utility will buy PV power output at $0.25 per kWh under a 10-year agreement.
Design Intent. The Lillis Business Complex was intended to be an example of innovation, particularly with respect to energy and the environment. An aggressive energy goal of 40% beyond the minimum efficiency required by code set a challenging benchmark for many design decisions.
Other green design features flowed from the intent to achieve Leadership in Energy and Environmental Design (LEED) certification for the project.
Design Criteria and Validation. A desire for LEED certification provided the general criteria for the green features of the building (see Appendix G.2). The specific "40% better" energy benchmark provided the criterion for energy performance.
Extensive modeling and analysis of concepts and systems were conducted by various consultants (including ESBL) during the course of the design process as a means of verifying design approaches and implementation methods. The building was commissioned.
Key Design Features
• The third-largest PV array in Oregon, with a peak capacity of about 45 kW of electricity
• A green roof, the first application of this design approach at the university
• Extensive use of daylighting, involving light shelves and solar shading devices
• Efficient electric lighting using dimmable fluorescent lamps with electronic ballasts and day light sensor controls
• "Smart plugs" that are wired to occupancy sensors to turn off devices in unoccupied offices
• An integrated natural ventilation system to accommodate outdoor air needs (for accept able indoor air quality [IAQ]), to cool the space and people, and to cool the thermal mass; ceiling fans augment the ventilation system
• Thermal mass to provide storage capacity for ventilation cooling and help the building heat up more slowly in summer and cool more slowly in winter
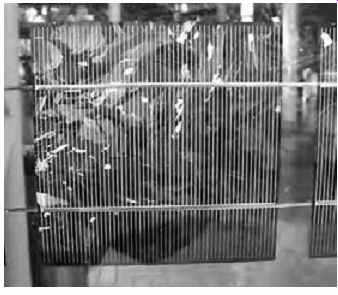
FIGR. 22 Close-up view of an embedded polycrystalline PV cell at the Lillis
Business Complex with interconnecting conductor strips. (Photo © 2004 by Alison
Kwok; all rights reserved.)
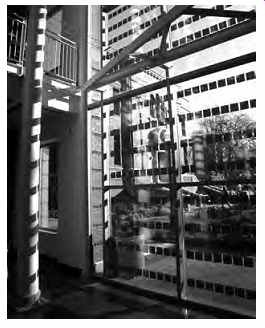
FIGR. 23 View from the atrium of the Lillis Business Complex; the integrated
PV cells provide partial shading and a lively lighting pattern. (Photo © 2004
by Alison Kwok; all rights reserved.)
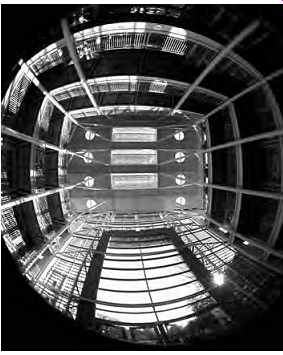
FIGR. 24 Fisheye view of the Lillis Business Complex atrium.
The south-facing panels of the rectangular skylights also contain embedded PV cells. (Photo © 2004 by Alison Kwok; all rights reserved.)
These two PV applications are good examples of BIPV. The PV cells are integrated into the glazing units such that these units are also the PV modules. In addition, another 6 kW (dc) of PV units are installed on sloping penthouse roof panels, and another 30 kW (dc) installed horizontally. Each element of the PV system is connected to separate inverter systems to maximize system output.
FOR FURTHER INFORMATION
Brown, G. Z., et al. 2004. "A Lesson in Green," in Solar Today, Vol. 18, No. 2.
Post-Occupancy Validation Methods and Performance Data. The building is too recently occupied to provide much in the way of verifiable performance data (although a POE study is under way as of this writing). Instead, more information on the PV components is given here. The total PV system output is approximately 45 kW peak (dc). There are four distinct PV elements in the building.
These include the PV cells integrated into the south-facing glass curtain wall at the entry, which produce about 6 kW (dc), and 2.7 kW (dc) of PV cells incorporated into skylights above the atrium.
References and Resources
Various standards from IEC, IEEE, and UL dealing with PV systems are presented in Section 10.
ACSA. 1993. Design for PV. Association of Collegiate Schools of Architecture. Washington, DC.
CIBSE. 2000. Understanding Building Integrated Photovoltaics. The Chartered Institute of Building Ser vice Engineers. London.
Florida Solar Energy Center. 2008. Solar Electricity
Markvart, T. (ed.). 2000. Solar Electricity, 2nd ed.John Wiley & Sons. New York.
Messenger, R. and J. Ventre. 2003. Photovoltaic Systems Engineering, 2nd ed. CRC Press. Boca Raton, FL.
Sandia National Laboratories. 2004. Photovoltaic Systems Research & Development
Strong, S. 1994. The Solar Electric House: Energy for the Environmentally-Responsive, Energy-Independent Home. Sustainability Press. Still River, MA.
U.S. Department of Energy. 2008. Solar Energy Technologies Program: Photovoltaics
Prev. | Next
Home Similar
articles top
of page