6. PROCESS MODELS AND PROJECT MANAGEMENT
We have seen how different aspects of a project can affect the effort, cost, and schedule required, as well as the risks involved. Managers most successful at building quality products on time and within budget are those who tailor the project management techniques to the particular characteristics of the resources needed, the chosen process, and the people assigned.
To understand what to do on your next project, it is useful to examine project management techniques used by successful projects from the recent past. In this section, we look at two projects: Digital's Alpha AXP program and the F-16 aircraft soft ware. We also investigate the merging of process and project management.
Enrollment Management
Digital Equipment Corporation spent many years developing its Alpha AXP system, a new system architecture and associated products that formed the largest project in DEC's history. The software portion of the effort involved four operating systems and 22 software engineering groups, whose roles included designing migration tools, network systems, compilers, databases, integration frameworks, and application& Unlike many other development projects, the major problems with Alpha involved reaching mile stones too early! Thus, it is instructive to look at how the project was managed and what effects the management process had on the final product.
During the course of development, the project managers developed a model that incorporated four tenets, called the Enrollment Management model:
1. establishing an appropriately large shared vision
2. delegating completely and eliciting specific commitments from participants
3. inspecting vigorously and providing supportive feedback
4. acknowledging every advance and learning as the program progressed (Conklin 1996)
FIG. 17 illustrates the model. Vision was used to "enroll" the related pro grams, so they all shared common goals. Each group or subgroup of the project defined its own objectives in terms of the global ones stated for the project, including the company's business goals. Next, as managers developed plans, they delegated tasks to groups, soliciting comments and commitments about the content of each task and the schedule constraints imposed. Each required result was measurable and identified with a particular owner who was held accountable for delivery. The owner may not have been the person doing the actual work; rather, he or she was the person responsible for getting the work done.
Managers continually inspected the project to make sure that delivery would be on time. Project team members were asked to identify risks, and when a risk threatened to keep the team from meeting its commitments, the project manager declared the project to be a "cusp": a critical event. Such a declaration meant that team members were ready to make substantial changes to help move the project forward. For each L J project step, the managers acknowledged progress both personally and publicly. They recorded what had been learned and they asked team members how things could be improved the next time.
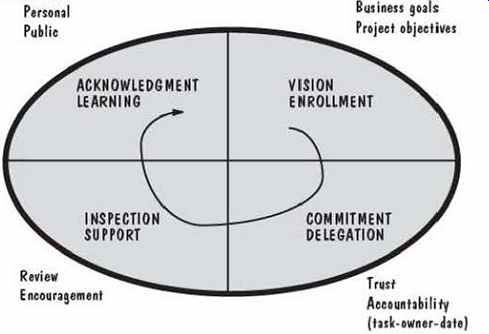
FIG. 17 Enrollment Management model (Conklin 1996).
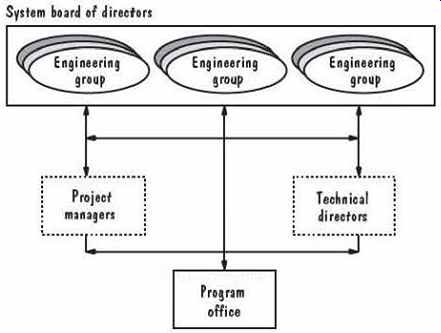
FIG. 18 Alpha project organization (Conklin 1996).
Coordinating all the hardware and software groups was difficult, and managers realized that they had to oversee both technical and project events. That is, the technical focus involved technical design and strategy, whereas the project focus addressed commitments and deliverables. FIG. 18 illustrates the organization that allowed both foci to contribute to the overall program.
The simplicity of the model and organization does not mean that managing the Alpha program was simple. Several cusps threatened the project and were dealt with in a variety of ways. For example, management was unable to produce an overall plan, and project managers had difficulty coping. At the same time, technical leaders were generating unacceptably large design documents that were difficult to understand. To gain control, the Alpha program managers needed a program-wide work plan that illustrated the order in which each contributing task was to be done and how it coordinated with the other tasks. They created a master plan based only on the critical program components those things that were critical to business success. The plan was restricted to a single page, so that the participants could see the "big picture," without complexity or detail. Similarly, one -page descriptions of designs, schedules, and other key items enabled project participants to have a global picture of what to do, and when and how to do it.
Another cusp occurred when a critical task was announced to be several months behind schedule. The management addressed this problem by instituting regular operational inspections of progress so there would be no more surprises. The inspection involved presentation of a one -page report, itemizing key points about the project:
- schedule
- milestones
- critical path events in the past month
- activities along the critical path in the next month
- issues and dependencies resolved
- issues and dependencies not resolved (with ownership and due dates)
An important aspect of Alpha's success was the managers' realization that engineers are usually motivated more by recognition than by financial gain. Instead of rewarding participants with money, they focused on announcing progress and on making sure that the public knew how much the managers appreciated the engineers' work.
The result of Alpha's flexible and focused management was a program that met its schedule to the month, despite setbacks along the way. Enrollment management enabled small groups to recognize their potential problems early and take steps to handle them while the problems were small and localized. Constancy of purpose was combined with continual learning to produce an exceptional product. Alpha met its performance goals, and its quality was reported to be very high.
Accountability Modeling
The U.S. Air Force and Lockheed Martin formed! an Integrated Product Development Team to build a modular software system designed to increase capacity, provide needed functionality, and reduce the cost and schedule of future software changes to the F-16 aircraft. The resulting software included more than four million lines of code, a quarter of which met real-time deadlines in flight. F-16 development also involved building device drivers, real-time extensions to the Ada run-time system, a software engineering workstation network, an Ada compiler for the modular mission computer, software build and configuration management tools, simulation and test software, and interfaces for loading software into the airplane (Parris 1996).
The flight software's capability requirements were well-understood and stable, even though about a million lines of code were expected to be needed from the 250 developers organized as eight product teams, a chief engineer, plus a program manager and staff. However, the familiar capabilities were to be implemented in an unfamiliar way: modular software using Ada and object-oriented design and analysis, plus a transition from mainframes to workstations. Project management constraints included rigid "need dates" and commitment to developing three releases of equal task size, called tapes. The approach was high risk, because the first tape included little time for learning the new methods and tools, including concurrent development (Parris 1996).
Pressure on the project increased because funding levels were cut and schedule deadlines were considered to be extremely unrealistic. In addition, the project was organized in a way unfamiliar to most of the engineers. The participants were used to working in a matrix organization, so that each engineer belonged to a functional unit based on a type of skill (such as the design group or the test group) but was assigned to one or more projects as that skill was needed. In other words, an employee could be identified by his or her place in a matrix, with functional skills as one dimension and project names as the other dimension. Decisions were made by the functional unit hierarchy in this traditional organization. However, the contract for the F-16 required the project to be organized as an integrated product development team: combining individuals from different functional groups into an interdisciplinary work unit empowered with separate channels of accountability.
To enable the project members to handle the culture change associated with the new organization, the F-16 project used the accountability model shown in FIG. 19.
In the model, a team is any collection of people responsible for producing a given result. A stakeholder is anyone affected by that result or the way in which the result is achieved. The process involves a continuing exchange of accountings (a report of what you have done, are doing, or plan to do) and consequences, with the goal of doing only what makes sense for both the team and the stakeholders. The model was applied to the design of management systems and to team operating procedures, replacing independent behaviors with interdependence, emphasizing "being good rather than looking good" (Parris 1996).
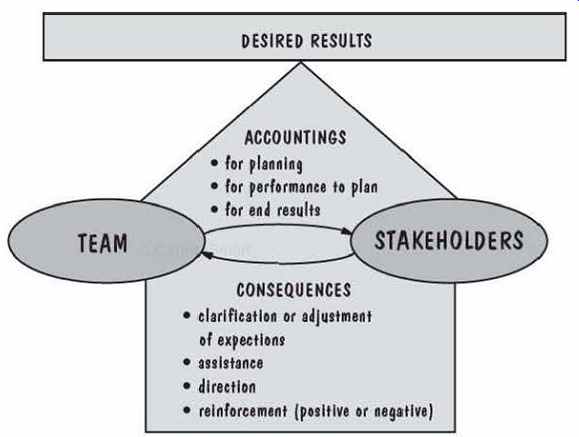
FIG. 19 Accountability model (Parris 1996).
As a result, several practices were required, including a weekly, one -hour team status review. To reinforce the notions of responsibility and accountability, each personal action item had explicit closure criteria and was tracked to completion.
An action item could be assigned to a team member or a stakeholder, and often involved clarifying issues or requirements, providing missing information or reconciling conflicts.
Because the teams had multiple, overlapping activities, an activity map was used to illustrate progress on each activity in the overall context of the project. FIG. 20 shows part of an activity map. You can see how each bar represents an activity, and each activity is assigned a method for reporting progress. The point on a bar indicates when detailed planning should be in place to guide activities. The "today" line shows current status, and an activity map was used during the weekly reviews as an overview of the progress to be discussed.
For each activity, progress was tracked using an appropriate evaluation or performance method. Sometimes the method included cost estimation, critical path analysis, or schedule tracking. Earned value was used as a common measure for comparing progress on different activities: a scheme for comparing activities determined how much of the project had been completed by each activity. The earned -value calculation included weights to represent what percent of the total process each step constituted, relative to overall effort. Similarly, each component was assigned a size value that represented its proportion of the total product, so that progress relative to the final size could be tracked, too. Then, an earned-value summary chart, similar to FIG. 21, was presented at each review meeting.
Once part of a product was completed, its progress was no longer tracked.
Instead, its performance was tracked, and problems were recorded. Each problem was assigned a priority by the stakeholders, and a snapshot of the top five problems on each product team's list was presented at the weekly review meeting for discussion. The priority lists generated discussion about why the problems occurred, what work-arounds could be put in place, and how similar problems could be prevented in the future.
The project managers found a major problem with the accountability model: it told them nothing about coordination among different teams. As a result, they built software to catalog and track the hand-offs from one team to another, so that every team could understand who was waiting for action or products from them. A model of the hand-offs was used for planning, so that undesirable patterns or scenarios could be eliminated. Thus, an examination of the hand-off model became part of the review process.
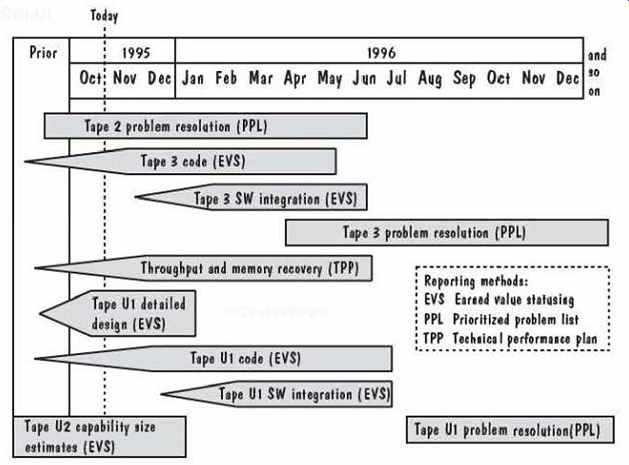
FIG. 20 Sample activity roadmap (adapted from Parris 1996).
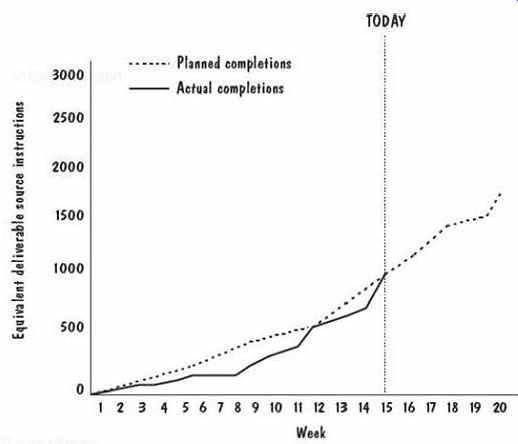
FIG. 21 Example earned -value summary chart (Parris 1996).
It is easy to see how the accountability model, coupled with the hand-off model, addressed several aspects of project management. First, it provided a mechanism for communication and coordination. Second, it encouraged risk management, especially by forcing team members to examine problems in review meeting& And third, it integrated progress reporting with problem solving. Thus, the model actually prescribes a project management process that was followed on the F-16 project.
Anchoring Milestones
In Section 2, we examined many process models that described how the technical activities of software development should progress. Then, in this section, we looked at several methods to organize projects to perform those activities. The Alpha AXP and F-16 examples have shown us that project management must be tightly integrated with the development process, not just for tracking progress, but, more importantly, for effective planning and decision making to prevent major problems from derailing the project. Boehm (1996) has identified three milestones common to all software development processes that can serve as a basis for both technical process and project management:
- life -cycle objectives
- life -cycle architecture
- initial operational capability
We can examine each milestone in more detail.
The purpose of the life-cycle objectives milestone is to make sure the stakeholders agree with the system's goals. The key stakeholders act as a team to determine the system boundary, the environment in which the system will operate, and the external systems with which the system must interact. Then, the stakeholders work through scenarios of how the system will be used. The scenarios can be expressed in terms of proto types, screen layouts, data flows, or other representations, some of which we will learn about in later sections. If the system is business- or safety-critical, the scenarios should also include instances where the system fails, so that designers can determine how the system is supposed to react to or even avoid a critical failure. Similarly, other essential features of the system are derived and agreed upon. The result is an initial life -cycle plan that lays out (Boehm 1996):
Objectives: Why is the system being developed?
Milestones and schedules: What will be done by when?
Responsibilities: Who is responsible for a function?
Approach: How will the job be done, technically and managerially?
Resources: How much of each resource is needed?
Feasibility: Can this be done, and is there a good business reason for doing it? The life -cycle architecture is coordinated with the life-cycle objectives. The purpose of the life-cycle architecture milestone is defining both the system and the soft ware architectures, the components of which we will study in Sections 5, 6, and 7. The architectural choices must address the project risks addressed by the risk management plan, focusing on system evolution in the long term as well as system requirements in the short term.
The key elements of the initial operational capability are the readiness of the soft ware itself, the site at which the system will be used, and the selection and training of the team that will use it. Boehm notes that different processes can be used to implement the initial operational capability, and different estimating techniques can be applied at different stages.
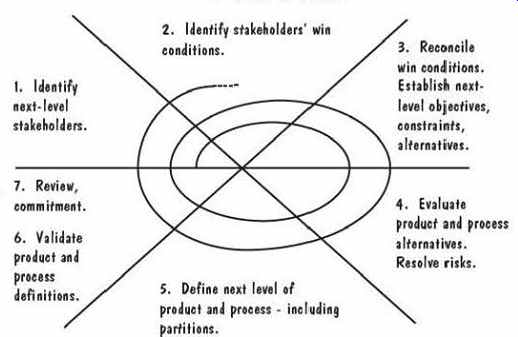
FIG. 22 Win-Win spiral model (Boehm 1996).
To supplement these milestones, Boehm suggests using the Win-Win spiral model, illustrated in FIG. 22 and intended to be an extension of the spiral model we examined in Section 2. The model encourages participants to converge on a common understanding of the system's next-level objectives, alternatives, and constraints.
Boehm applied Win-Win, called the Theory W approach, to the U.S. Department of Defense's STARS program, whose focus was developing a set of prototype software engineering environments. The project was a good candidate for Theory W, because there was a great mismatch between what the government was planning to build and what the potential users needed and wanted. The Win-Win model led to several key compromises, including negotiation of a set of common, open interface specifications to enable tool vendors to reach a larger marketplace at reduced cost, and the inclusion of three demonstration projects to reduce risk. Boehm reports that Air Force costs on the project were reduced from $140 to $57 per delivered line of code and that quality improved from 3 to 0.035 faults per thousand delivered lines of code. Several other projects report similar success. TRW developed over half a million lines of code for complex distributed software within budget and schedule using Boehm's milestones with five increments. The first increment included distributed kernel software as part of the lifecycle architecture milestone; the project was required to demonstrate its ability to meet projections that the number of requirements would grow over time (Royce 1990).
7. INFORMATION SYSTEMS EXAMPLE
Let us return to the Piccadilly Television airtime sales system to see how we might estimate the amount of effort required to build the software. Because we are in the preliminary stages of understanding just what the software is to do, we can use COCOMO II's initial effort model to suggest the number of person -months needed. A person -month is the amount of time one person spends working on a software development project for one month. The COCOMO model assumes that the number of person-months does not include holidays and vacations, nor time off at weekend& The number of person-months is not the same as the time needed to finish building the system. For instance, a system may require 100 person -months, but it can be finished in one month by having ten people work in parallel for one month, or in two months by having five people work in parallel (assuming that the tasks can be accomplished in that manner).
The first COCOMO II model, application composition, is designed to be used in the earliest stages of development. Here, we compute application points to help us determine the likely size of the project. The application point count is determined from three calculations: the number of server data tables used with a screen or report, the number of client data tables used with a screen or report, and the percentage of screens, reports, and modules reused from previous applications. Let us assume that we are not reusing any code in building the Piccadilly system. Then we must begin our estimation process. by predicting bow many screens and reports we will be using in this application.
Suppose our initial estimate is that we need three screens and one report:
- a booking screen to record a new advertising sales booking
- a rate-card screen showing the advertising rates for each day and hour
- an availability screen showing which time slots are available
- a sales report showing total sales for the month and year, and comparing them with previous months and years
TABLE 15 Ratings for Piccadilly Screens and Reports
For each screen or report, we use the guidance in TABLE 10 and an estimate of the number of data tables needed to produce a description of the screen or report. For example, the booking screen may require the use of three data tables: a table of available time slots, a table of past usage by this customer, and a table of the contact information for this customer (such as name, address, tax number, and sales representative handling the sale). Thus, the number of data tables is fewer than four, so we must decide whether we need more than eight views. Since we are likely to need fewer than eight views, we rate the booking screen as "simple" according to the application point table. Similarly, we may rate the rate-card screen as "simple," the availability screen as "medium," and the sales report as "medium." Next, we use TABLE 11 to assign a complexity rate of 1 to simple screens, 2 to medium screens, and 5 to medium reports; a summary of our ratings is shown in TABLE 15.
We add all the weights in the rightmost column to generate a count of new application points (NOPS): 9. Suppose our developers have low experience and low CASE maturity. TABLE 12 tells us that the productivity rate for this circumstance is 7. Then the COCOMO model tells us that the estimated effort to build the Piccadilly system is NOP divided by the productivity rate, or 1.29 person-months.
As we understand more about the requirements for Piccadilly, we can use the other parts of COCOMO: the early design model and the post-architecture model, based on nominal effort estimates derived from lines of code or function points.
These models use a scale exponent computed from the project's scale factors, listed in TABLE 16.
TABLE 16 Scale Factors for COCOMO II Early Design and Post-architecture Models
"Extra high" is equivalent to a rating of zero, "very high" to 1, "high" to 2, "nominal" to 3, "low" to 4, and "very low" to 5. Each of the scale factors is rated, and the sum of all ratings is used to weight the initial effort estimate. For example, suppose we know that the type of application we are building for Piccadilly is generally familiar to the development team; we can rate the first scale factor as "high." Similarly, we may rate flexibility as "very high," risk resolution as "nominal," team interaction as "high," and the maturity rating may turn out to be "low." We sum the ratings (2 + 1 + 3 + 2 + 4) to get a scale factor of 12. Then, we compute the scale exponent to be + 0.01(12) or 1.13. This scale exponent tells us that if our initial effort estimate is 100 person-months, then our new estimate, relative to the characteristics reflected in TABLE 16, is 1001.13, or 182 person -months. In a similar way, the cost drivers adjust this estimate based on characteristics such as tool usage, analyst expertise, and reliability requirements. Once we calculate the adjustment factor, we multiply by our 182 person -months estimate to yield an adjusted effort estimate.
8. REAL-TIME EXAMPLE
The board investigating the Ariane-5 failure examined the software, the documentation, and the data captured before and during flight to determine what caused the fail ure (Lions et al. 1996). Its report notes that the launcher began to disintegrate 39 seconds after takeoff because the angle of attack exceeded 20 degrees, causing the boosters to separate from the main stage of the rocket; this separation triggered the launcher's self-destruction. The angle of attack was determined by software in the on board computer on the basis of data transmitted by the active inertial reference system, SRI2. As the report notes, SRI2 was supposed to contain valid flight data, but instead it contained a diagnostic bit pattern that was interpreted erroneously as flight data. The erroneous data had been declared a failure, and the SRI2 had been shut off. Normally, the on-board computer would have switched to the other inertial reference system, SRI1, but that, too, had been shut down for the same reason.
The error occurred in a software module that computed meaningful results only before lift-off. As soon as the launcher lifted off, the function performed by this module served no useful purpose, so it was no longer needed by the rest of the system. How ever, the module continued its computations for approximately 40 seconds of flight based on a requirement for the Ariane-4 that was not needed for Ariane-5.
The internal events that led to the failure were reproduced by simulation calculations supported by memory readouts and examination of the software itself Thus, the Ariane-5 destruction might have been prevented had the project managers developed a risk management plan, reviewed it, and developed risk avoidance or mitigation plans for each identified risk. To see how, consider again the steps of FIG. 15. The first stage of risk assessment is risk identification. The possible problem with reuse of the Ariane-4 software might have been identified by a decomposition of the functions;
someone might have recognized early on that the requirements for Ariane-5 were different from Ariane-4. Or an assumption analysis might have revealed that the assumptions for the SRI in Ariane-4 were different from those for Ariane-5.
Once the risks were identified, the analysis phase might have included simulations, which probably would have highlighted the problem that eventually caused the rocket's destruction. And prioritization would have identified the risk exposure if the SRI did not work as planned; the high exposure might have prompted the project team to examine the SRI and its workings more carefully before implementation.
Risk control involves risk reduction, management planning, and risk resolution.
Even if the risk assessment activities had missed the problems inherent in reusing the SRI from Ariane-4 risk reduction techniques including risk avoidance analysis might have noted that both SRIs could have been shut down for the same underlying cause.
Risk avoidance might have involved using SRIs with two different designs, so that the design error would have shut down one but not the other. Or the fact that the SRI calculations were not needed after lift-off might have prompted the designers or implementers to shut down the SRI earlier, before it corrupted the data for the angle calculations. Similarly, risk resolution includes plans for mitigation and continual reassessment of risk. Even if the risk of SRI failure had not been caught earlier, a risk reassessment during design or even during unit testing might have revealed the problem in the middle of development. A redesign or development at that stage would have been costly, but not as costly as the complete loss of Ariane-5 on its maiden voyage.
9. WHAT THIS SECTION MEANS FOR YOU
This section has introduced you to some of the key concepts in project management, including project planning, cost and schedule estimation, risk management, and team organization. You can make use of this information in many ways, even if you are not a manager. Project planning involves input from all team members, including you, and understanding the planning process and estimation techniques gives you a good idea of how your input will be used to make decisions for the whole team. Also, we have seen how the number of possible communication paths grows as the size of the team increases. You can take communication into account when you are planning your work and estimating the time it will take you to complete your next task.
We have also seen how communication styles differ and how they affect the way we interact with each other on the job. By understanding your teammates' styles, you can create reports and presentations for them that match their expectations and needs. You can prepare summary information for people with a bottom -line style and offer complete analytical information to those who are rational.
10. WHAT THIS SECTION MEANS FOR YOUR DEVELOPMENT TEAM
At the same time, you have learned how to organize a development team so that team interaction helps produce a better product. There are several choices for team structure, from a hierarchical chief programmer team to a loose, egoless approach.
Each has its benefits, and each depends to some degree on the uncertainty and size of the project.
We have also seen how the team can work to anticipate and reduce risk from the project's beginning. Redundant functionality, team reviews, and other techniques can help us catch errors early, before they become embedded in the code as faults waiting to cause failures.
Similarly, cost estimation should be done early and often, including input from team members about progress in specifying, designing, coding, and testing the system.
Cost estimation and risk management can work hand in hand; as cost estimates raise concerns about finishing on time and within budget, risk management techniques can be used to mitigate or even eliminate risks.
11. WHAT THIS SECTION MEANS FOR RESEARCHERS
This section has described many techniques that still require a great deal of research.
Little is known about which team organizations work best in which situations. Like wise, cost- and schedule -estimation models are not as accurate as we would like them to be, and improvements can be made as we learn more about how project, process, product, and resource characteristics affect our efficiency and productivity. Some methods, such as machine learning, look promising but require a great deal of historical data to make them accurate. Researchers can help us to understand how to balance practicality with accuracy when using estimation techniques.
Similarly, a great deal of research is needed in making risk management techniques practical. The calculation of risk exposure is currently more an art than a science, and we need methods to help us make our risk calculations more relevant and our mitigation techniques more effective.
12. TERM PROJECT
Often, a company or organization must estimate the effort and time required to complete a project, even before detailed requirements are prepared. Using the approaches described in this section, or a tool of your choosing from other sources, estimate the effort required to build the Loan Arranger system. How many people will be required? What kinds of skills should they have? How much experience? What kinds of tools or techniques can you use to shorten the amount of time that development will take? You may want to use more than one approach to generate your estimates. If you do, then compare and contrast the results. Examine each approach (its models and assumptions) to see what accounts for any substantial differences among estimates.
Once you have your estimates, evaluate them and their underlying assumptions to see how much uncertainty exists in them. Then, perform a risk analysis. Save your results; you can examine them at the end of the project to see which risks turned into real problems, and which ones were mitigated by your chosen risk strategies.
13. REFERENCES
A great deal of information about COCOMO is available from the Center for Software Engineering at the University of Southern California. The USC Web site points to current research on COCOMO, including a Java implementation of COCOMO II. It is at this site that you can also find out about COCOMO user -group meetings and obtain a copy of the COCOMO II user's manual. Related information about function points is available from IFPUG, the International Function Point User Group, in Westerville, Ohio.
The Center for Software Engineering also performs research on risk management. You can ftp a copy of its Software Risk Technical Advisor at usc.edu/pub and read about current research at sunset.usc.edu.
PC-based tools to support estimation are described and available from the Web site for Bournemouth University's Empirical Software Engineering Research Group:
dec.bournemouth.ac.uk/ESERG.
Several companies producing commercial project management and cost-estimation tools have information available on their Web sites. Quantitative Software Management, producers of the SLIM cost-estimation package, is located at qsm.com.
Likewise, Software Productivity Research offers a package called Checkpoint. Information can be found at spr.com. Computer Associates has developed a large suite of project management tools, including Estimacs for cost estimation and Planmacs for planning. A full description of its products is at cai.com/products.
The Software Technology Support Center at Hill Air Force Base in Ogden, Utah, produces a newsletter called CrossTalk that reports on method and tool evaluation. Its guidelines for successful acquisition and management can be found at stsc.hill.af.mil/stscdocs.html. The Center's Web pages also contain pointers to several technology areas, including project management and cost estimation; you can find the listing at stsc.hill.af.mil.
Team building and team interaction are essential on good software projects. Weinberg (1993) discusses work styles and their application to team building in the second volume of his series on software quality. Scholtes (1995) includes material on how to handle difficult team members.
Project management for small projects is necessarily different from that for large projects. The October 1999 issue of IEEE Computer addresses software engineering in the small, with articles about small projects, Internet time pressures, and extreme programming.
Project management for Web applications is somewhat different from more traditional software engineering. Mendes and Moseley (2006) explore the differences.
In particular, they address estimation for Web applications in their book on "Web engineering."
14 EXERCISES
1. You are about to bake a two-layer birthday cake with icing. Describe the cake -baking project as a work breakdown structure. Generate an activity graph from that structure.
What is the critical path?
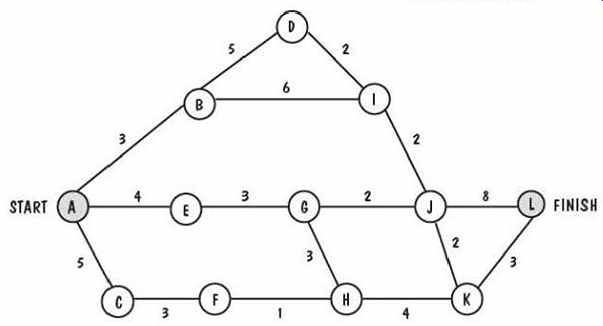
FIG. 23 Activity graph for Exercise 2.
2. FIG. 23 is an activity graph for a software development project. The number corresponding to each edge of the graph indicates the number of days required to complete the activity represented by that branch. For example, it will take four days to complete the activity that ends in milestone E. For each activity, list its precursors and compute the earliest start time, the latest start time, and the slack. Then, identify the critical path.
3. FIG. 24 is an activity graph. Find the critical path.
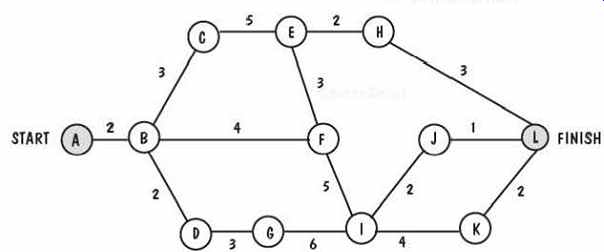
FIG. 24 Activity graph for Exercise 3.
4. On a software development project, what kinds of activities can be performed in parallel?
Explain why the activity graph sometimes hides the interdependencies of these activities.
5. Describe how adding personnel to a project that is behind schedule might make the project completion date even later.
6. A large government agency wants to contract with a software development firm for a project involving 20,000 lines of code. The Hardand Software Company uses Walston and Felix's estimating technique for determining the number of people required for the time needed to write that much code. How many person-months does Hardand estimate will be needed? If the government's estimate of size is 10% too low (i.e., 20,003 lines of code represent only 90% of the actual size), how many additional person -months will be needed? In general, if the government's size estimate is k% too low, by how much must the person-month estimate change?
7. Explain why it takes longer to develop a utility program than an applications program and longer still to develop a system program.
8. Manny's Manufacturing must decide whether to build or buy a software package to keep track of its inventory. Manny's computer experts estimate that it will cost $325,000 to buy the necessary programs. To build the programs in-house, programmers will cost $5000 each per month. What factors should Manny consider in making his decision? When is it better to build? To buy?
9. Brooks says that adding people to a late project makes it even later. Some schedule -estimation techniques seem to indicate that adding people to a project can shorten development time. Is this a contradiction? Why or why not?
10. Many studies indicate that two of the major reasons that a project is late are changing requirements (called requirements volatility or instability) and employee turnover.
Review the cost models discussed in this section, plus any you may use on your job, and determine which models have cost factors that reflect the effects of these reasons.
11. Even on your student projects, there are significant risks to your finishing your project on time. Analyze a student software development project and list the risks. What is the risk exposure? What techniques can you use to mitigate each risk?
12. Many project managers plan their schedules based on programmer productivity on past projects. This productivity is often measured in terms of a unit of size per unit of time. For example, an organization may produce 300 lines of code per day or 1200 application points per month. Is it appropriate to measure productivity in this way? Discuss the measurement of productivity in terms of the following issues:
• Different languages can produce different numbers of lines of code for implementation of the same design.
• Productivity in lines of code cannot be measured until implementation begins.
• Programmers may structure code to meet productivity goals.
PREV. | NEXT
