| HOME | Project Management Data Warehousing / Mining Software Testing | Technical Writing |
|
6. Process Management Process A software process is not a static entity-it has to change to improve so that the products produced using the process are of higher quality and are less costly. Reducing cost and improving quality are fundamental goals of engineering. For producing software it implies that the software process must continually be improved, as cost and quality of products are determined to a great extent by the process. As stated earlier, this is the objective of the process management process. It should be emphasized that process management is quite different from project management. In process management the focus is on improving the process that improves the general quality and productivity for the products produced using the process. In project management the focus is on executing the current project and ensuring that the objectives of the project are met. The time duration of interest for project management is typically the duration of the project, while process management works on a much larger time scale as each project is viewed as providing a data point for the process. Process management is an advanced topic beyond the scope of this guide. Interested readers are referred to the guide by Humphrey. We will only briefly discuss some aspects here. However, one aspect of process management is to build models for the process by which the nature of the relationship between some metric values for the process can be captured. As these models directly affect project management, we will discuss this issue in some detail. 6.1 Building Estimation Models It is not always easy to define metrics to quantify many quality attributes (e.g. usability), and for many others where metrics can be defined it is not easy to measure the value (e.g. reliability). In such cases, it is important to build models that can be used to estimate or predict the (quality) parameter of interest by using the metric values that can be measured and the model. These models can then be used for project management in predicting various parameters of interest for the project. Such models are generally process-specific as the property of interest depends on the process. That is, if the process changes, the value of the property will change even if the input values (i.e., the metrics that have been measured) are the same. For example, suppose there is a strong correlation between the value of some complexity metric and total testing effort. The actual correlation will clearly depend on the process. A process using good tools and methods will consume less effort than an ad-hoc process not using any tools, even for the same complexity. Though the models capture properties of the process, they are used heavily in project management. As discussed earlier, project management uses the models to predict some values of interest, and these predicted values can then be used for project monitoring. For example, there is a strong dependence of the total effort required for a project on the project size. However, the actual nature of the dependence depends on the process-a very efficient process with high productivity will consume a lot less effort for the same project compared to an inefficient process. Once the model for a particular process is built, it can be used for effort estimation by projects using this process. In fact, this is how cost and schedule estimation is done for processes. Hence, we can say that models capture some aspects of the process that are quite often important for project management. Hence, for effective project management, it is important that appropriate models be built for the process. A model for the software process (or a part of it) can be represented as: Y = !(Xl, X2,"" xn). The dependent variable y is the metric of interest (e.g., total effort, reliability, etc.). Xl, X2, ... ,Xli are independent variables that typically represent some metric values that can be measured when this model is to be applied. The function is really the model itself that specifies how Y depends on these independent variables for the process. A model may be theoretical or data-driven. In a theoretical model, the relationship between the dependent and independent variables is determined by some existing relationships that are known. Such models are independent of data. Data-driven models are generally the result of statistical analysis of the data collected about the process from previous projects. In these models, one hypothesizes some model, whose actual parameters are then determined through the analysis of data. Many of the process models used in project management are data-driven. Collecting data for building such models is the major reason for the termination analysis phase of the management process. Let us briefly discuss how data-driven models are constructed. It is clear that for data-driven models, data from past projects is needed to obtain the model. The larger the data set, the more accurate the model. The goal of building a model is to determine the relationship between a metric of interest and some other metric values. The simplest such model is one with only one independent variable, that is, to determine the relationship between two variables, say, Y (variable of interest) and X (variable whose value could be measured).
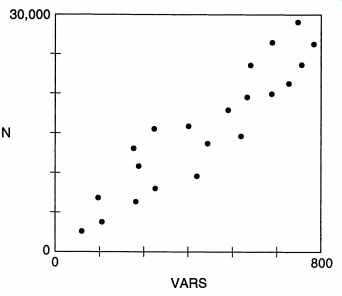
The first question is whether there is any relationship between them. Suppose for the last n projects we have the values of Y and x and our data set is (XI, YI), (X2, Y2), ... , (xn, Yn). This can be done graphically by drawing a scatter plot, in which points for all the x - Y pairs are drawn. If the graph, containing n points, shows some pattern, one can say that there is some relationship between them. For example, the scatter plot of the total length of Pascal programs (N) and the number of different variables (VARS) is shown in FIG. 13. The scatter plot clearly shows that there is a relationship between N and VARS. It also suggests that the relationship is probably linear, though the relationship is not perfect. Existence of relationship between the two variables can also be determined by determining the correlation between them. Correlation, in the statistical sense, implies that an interval change in one variable is accompanied by an interval change in the other variable. The strength of the correlation is captured by the correlation coefficient. If we assume that the relationship is linear then the correlation coefficient r can be determined by the following equation: r = _1_ L (x - i) (y - y) n - 1 Sx Sy where i and y represent the means of the values of x and y, and Sx and Sy are the standard deviations of the samples of x and y. Incorporating the equations for standard deviation and means, one gets: n L(XY) - (LX)(LY) .j(n LX2 - (Lx)2)(n Ly2 - (Ly)2) If r = I, it implies that there is a perfect correlation. In such a case, all the points in the scatter plot will lie exactly on a straight line (i.e., one line will pass through all the points). When there is no (linear) relationship between x and y, the value of r is close to 0. As this is a statistical analysis, its accuracy will depend on the size of the data set (i.e., the larger n is, the more accurate the correlation). This method determines if there is a linear correlation between two variables and the strength of the correlation. It does not determine the exact nature of the relationship. That is, the correlation coefficient analysis does not specify the straight line that can capture the linear relationship between the two. It is desirable to represent the linear relationship between the variables in terms of an equation. That is, if y is the dependent variable and x is the independent variable, we are looking for the constants a and b such that the equation y = ax +b closely represents the equation capturing the relationship between x and y. To determine the constants a and b, typically a regression analysis needs to be done. The basic idea in regression analysis is to fit a line through the data points in the scatter plot so that the sum of squares of the distance from the line of the points is minimized. With this as the objective, these coefficients can be determined as: (Xi - i)(Yi - ji) a=---~-'c L(Xi - x)2 b=ji-ai The line specified by these coefficients is called the regression line. This regression line captures the linear relationship between Y and x. Note that a regression line can be "fitted" with any data set; whether fitting a line is proper or not is determined by the correlation coefficient. Once such a model between two variables is built for a process (and the two variables have been shown to have a strong correlation), the y value for a project can be estimated if its x value is known. That is, if for an ongoing project only the x value can be measured but the desire of the project management is to estimate the value of the variable y, this equation can be used for estimation. So, what is being done is that from the data of the completed projects (or the past projects) for which both the x and y values are known, the equation representing the relationship between x and y is determined, which is then used by the project management to estimate the value of y for projects where only x is known. Note that this approach implies that the process is under statistical control. If the variable of interest y is thought to be dependent on more than one vari able, then multivariate regression can be performed on the data set from the past projects. If the relationship between the two variables is not linear, then some times data transformation can be done to convert it into a linear relation. After this transformation, linear regression can be applied. For example, suppose y and x are believed to be related by a nonlinear equation of the type y =axb This equation can be converted into a linear equation by taking a log on both sides, giving the equation logy = loga+b logx. Now if we consider log y as Y and log x as X we have a linear equation, and we can perform the regression analysis on the data set (logxI,logyd, ... , (logxn,logYn). By regression analysis constants log a and b will be determined. From this, the original nonlinear equation can be determined. We leave the details of this as an exercise. Perhaps the most common example of using the models built this way is in cost estimation, where total effort is modeled as a function of the size of the project. The model for the process to be used for a project can be used to estimate the cost of the project, once the size is estimated (or determined). We will see these models in more detail when we discuss cost estimation in Section 4. The values of the measured variables is used in project management in other ways. Rather than building formal models in the manner described earlier, imprecise models are developed, which then form guidelines for project management. For example, an informal model may be constructed with some module complexity metric (say cyclomatic complexity), as follows. Based on experience with earlier projects it is seen that modules with cyclomatic complexity values greater than 10 show a lot of errors. Based on this experience, a model is built that those modules with a complexity greater than 10 are generally "error prone." Based on this model, the project management can require that all modules whose cyclomatic complexity is greater than 10 have to be reviewed, or tested individually. In other words, the cyclomatic complexity number is not being used to predict some other value, but it is being used directly for project management (in this case to ensure that quality objectives are met). Note that even this type of use requires developing some sort of model. Only the model need not be precise. Still, whether a complexity of 10 is acceptable or not (which essentially is the model here) has to be decided for the organization. In some cases, as these models are approximate, models from other organizations can also be used. If, on the other hand, the project management wants to use the cyclomatic complexity to estimate the number of errors that exist in a module or the effort that will be required to test the module, then an estimation model needs to be built as described earlier. In other words, a model for predicting the total number of errors or the total testing effort will have to be built from the complexity metric being used (assuming that a strong correlation exists). 6.2 Process Improvement and Maturity There is now considerable interest in improving the software process as it is recognized that only by improving the process can the quality and productivity be improved. Process improvement requires understanding the current process and its deficiencies and then taking actions to remove the deficiencies. This is possible only if the current process is under statistical control. Otherwise, even characterizing the process is not possible, leave aside improving it. Process improvement is an advanced topic beyond the scope of this guide. We only present some basic ideas here. We present two frameworks that have been used by various organizations to improve their process. Capability Maturity Model To improve its software process, an organization needs to first understand the status of the current status and then develop a plan to improve the process. It is generally agreed that changes to a process are best introduced in small increments and that it is not feasible to totally revolutionize a process. The reason is that it takes time to initialize and truly follow any new methods that may be introduced. And only when the new methods are properly implemented will their effects be visible. Introducing too many new methods for the software process will make the task of implementing the change very hard. If we agree that changes to a process must be introduced in small increments, the next question is out of a large set of possible enhancements to a process, in what order should the improvement activities be undertaken? Or what small change should be introduced first? This depends on the current state of the process. For example, if the process is very primitive there is no point in suggesting sophisticated metrics-based project control as an improvement strategy; incorporating it in a primitive process is not easy. On the other hand, if the process is already using many basic models, such a step might be the right step to further improve the process. Hence, deciding what activities to undertake for process improvement is a function of the current state of the process. Once some process improvement takes place, the process state may change, and a new set of possibilities may emerge. This concept of introducing changes in small increments based on the current state of the process has been captured in the Capability Maturity Model (CMM) framework. The CMM framework provides a general roadmap for process improvement. We give a brief description of the CMM framework here; the reader is referred to for more details. -------------
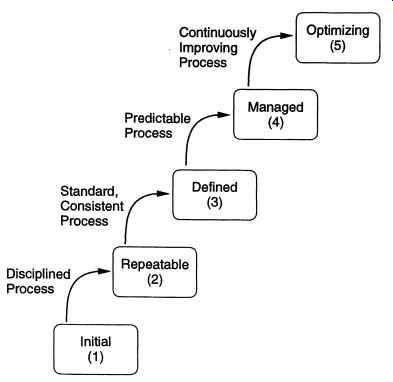
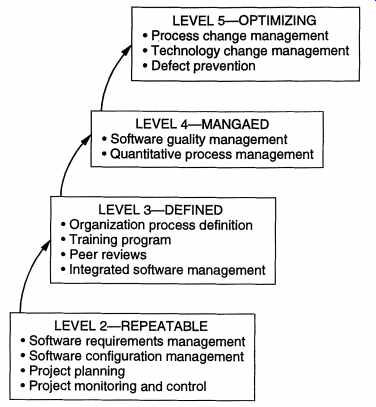
------------- Software process capability describes the range of expected results that can be achieved by following the process. The process capability of an organization determines what can be expected from the organization in terms of quality and productivity. The goal of process improvement is to improve the process capability. A maturity level is a well-defined evolutionary plateau toward achieving a mature software process [P+93]. Based on the empirical evidence found by examining the processes of many organizations, the CMM suggests that there are five well defined maturity levels for a software process. These are initial (level I ), repeatable, defined, managed, and optimizing (level 5). The CMM framework says that as process improvement is best incorporated in small increments, processes go from their current levels to the next higher level when they are improved. Hence, during the course of process improvement, a process moves from level to level until it reaches levels. This is shown in FIG. 14 [P+93]. The CMM provides characteristics of each level, which can be used to assess the current level of the process of an organization. As the movement from one level is to the next level, the characteristics of the levels also suggest the areas in which the process should be improved so that it can move to the next higher level. Essentially, for each level it specifies the areas in which improvement can be absorbed and will bring the maximum benefits. Overall, this provides a roadmap for continually improving the process. The initial process (level) is essentially an ad hoc process that has no formalized method for any activity. Basic project controls for ensuring that activities are being done properly and that the project plan is being adhered to are missing. In crisis the project plans and development processes are abandoned in favor of a code and-test type of approach. Success in such organizations depends solely on the quality and capability of individuals. The process capability is unpredictable as the process constantly changes. Organizations at this level can benefit most by improving project management, quality assurance, and change control. In a repeatable process (level 2), policies for managing a software project and procedures to implement those policies exist. That is, project management is well developed in a process at this level. Some of the characteristics of a process at this level are: project commitments are realistic and based on past experience with similar projects, cost and schedule are tracked and problems resolved when they arise, formal configuration control mechanisms are in place, and software project standards are defined and followed. Essentially, results obtained by this process can be repeated as the project planning and tracking is formal. At the defined level (level 3) the organization has standardized on a software pro cess, which is properly documented. A software process group exists in the organization that owns and manages the process. In the process each step is carefully defined with verifiable entry and exit criteria, methodologies for performing the step, and verification mechanisms for the output of the step. In this process both the development and management processes are formal. At the managed level (level 4) quantitative goals exist for process and products. Data is collected from software processes, which is used to build models to characterize the process. Hence, measurement plays an important role in a process at this level. Due to the models built, the organization has a good insight in the process and its deficiencies. The results of using such a process can be predicted in quantitative terms. At the optimizing level (level 5), the focus of the organization is on continuous process improvement. Data is collected and routinely analyzed to identify areas that can be strengthened to improve quality or productivity. New technologies and tools are introduced and their effects measured in an effort to improve the performance of the process. Best software engineering and management practices are used throughout the organization. This CMM framework can be used to improve the process. Improvement requires first assessing the level of the current process. This is typically done through the use of a detailed questionnaire, whose answers are used to judge the current level. Based on the current level, the areas in which maximum benefits can be derived are known from the framework. For example, for improving a process at level 1 (or for going from level 1 to level 2), project management and the change control activities must be made more formal. The complete CMM framework provides more details about which particular areas need to be strengthened to move up the maturity framework. This is generally done by specifying the key process areas of each maturity level, which in turn, can be used to determine which areas to strengthen to move up. Some of the key process areas of the different levels are shown in FIG. 15 [P+93]. ---------------------
LEVEL 5-OPTIMIZING • process change management • Technology change management • Defect prevention LEVEL 4-MANGAED • Software quality management • Quantitative process management LEVEL 3-DEFINED • Organization process definition • Training program • Peer reviews • Integrated software management LEVEL2--REPEATABLE • Software requirements management • Software configuration management • Project planning • Project monitoring and control --------------------- Though the CMM framework specifies the process areas that should be improved to increase the maturity of the process, it does not specify how to bring about the improvement. That is, it is essentially a framework that does not suggest detailed prescriptions for improvement, but guides the process improvement activity along the maturity levels such that process improvement is introduced in increments and the improvement activity at any time is clearly focused. Many organizations have successfully used this framework to improve their processes and hundreds of organizations have undergone formal or self-assessment of their capability. It is a major driving force for process improvement. Quality Improvement Paradigm and GQM A somewhat different approach for improving a process is taken by the Quality Improvement Paradigm (QIP). QIP does not specify levels or what areas to focus on for improvement. It gives a general method for improving a pro cess, essentially implying that what constitutes improvement of a process depends on the organization to which the process belongs and its objectives. The basic idea behind this approach is to understand the current process, set objectives for improvement, and then plan and execute the improvement actions. The QIP consists of six basic steps: Characterize. Understand the current process and the environment it operates in. • Set Goals. Based on the understanding of the process and the environment and objectives of the organization, set quantifiable goals for performance improvement. The goals should be reasonable. • Choose process. Based on the characterization and goals, choose the component processes that should be changed to meet the goals. • Execute. Execute projects using the processes and provide feedback data. • Analyze. Analyze the data at the end of each project. From the analysis, deter mine problems and make recommendations for improvements to be applied on future projects. • Package. Based on the experience gained from many projects, define and formalize the changes to be made to processes and expectation from the new processes. An important component of the QIP is the feedback cycle from the projects. The basic input for process improvement is provided by collecting appropriate data about existing projects. However, for the data to be useful for process improvement, it is imperative that data collection be very focused, and it should be dear how data is to be used in analysis. Collecting data randomly, just because the data is available, is of little use and leads to large volumes of useless data. For collecting proper data that will serve the purpose of process improvement, the Goal/Question/Metrics (GQM) paradigm is frequently used. The GQM paradigm suggests a general framework for collecting data from projects that can be used for a specific purpose. The basic premise behind this approach is that there is no "general set" of metrics to be collected. An organization must specify its goals before measuring anything. Then these goals should be translated to specific data along with a framework to evaluate the data collected. In other words, what should be measured and how it should be evaluated depends on the goals of the organization. The fact that many organizations tend to measure and track at least some metrics like effort spent, total number of errors found, and time spent is because most organizations have some similar goals like keeping the cost within projections and keeping the quality high. The similarity of some basic goals gives rise to a sort of "minimal set" of measures that every organization must keep track of. In general, however, the measurement must be for satisfying some objective of the organization. GQM proposes that to start the measurement activity we must set quality or productivity goals at some level (e.g., process level or a specific project level). An example of the goal could be to reduce the total number of field defects found in the products released by the organization. In this example, the goal is to improve the quality of the process so that fewer defects pass by. An organization may have many goals. For each goal, a set of questions has to be derived that, if answered satisfactorily, will let us see whether or not we are achieving the goal, that is, obtain a set of questions that define the goal. For example, if the goal is to reduce the number of field defects, a question could be what is currently the quality of the released products. The next step consists of defining metrics that need to be collected to answer these questions that have been framed for each goal. In other words, what data should be collected to provide an objective answer to each question? For example, for the question given earlier, one metric could be the number of field defects per KLOC, found within one year of the release of the product. Finally, data collection mechanisms have to be decided. GQM is a top-down approach that starts from the objectives and works its way down to the metrics needed. Though it is a general framework that can be used for metrics collection for project management, it is frequently used in the context of process improvement. The QIP and GQM have been used successfully by many organizations to improve their processes. 7. Summary There are three important entities that software engineering deals with-processes, projects, and products. Processes relate to the general method of doing something, project is an instance where a process is applied, and products are the outcomes of projects. A software process consists of different component processes that deal with these entities. The development process focuses on the development of products, project management deals with the activities needed to manage a development project, the configuration management process deals with change that takes place during a project, and the process management process deals with the issue of managing changes to the process itself and process improvement. We have seen that a software process, comprising at least these four component processes, must have some features in order to satisfy the basic software engineering objectives. The basic property is that the process must be predictable, that is, following the same process produces more or less similar results. The process must also support testability and maintainability, as testing and maintenance are the activities that consume the most resources. The process should support defect removal and prevention throughout development, as the longer a defect stays, the more costly it is to remove it. And the process must be self-improving. Then we studied the four major component processes of the software process. The software development process is traditionally the one that has been most emphasized as it deals with the development and quality activities of software development. Various process models have been proposed. The waterfall model is conceptually the simplest model of software development, where the requirement, design, coding, and testing phases are performed in linear progression. There is a defined output after each phase, which is certified before the next phase begins. It is the most widely used model, even though it has limitations. Another major model is the prototyping model, where a prototype is built before building the final system. Iterative enhancement and the spiral model are other models. Project management consists of three major phases-planning, monitoring and control, and termination analysis. Much of project management revolves around the project plan, which is produced during the planing phase. The monitoring and control phase requires accurate data about the project to reach project management, which uses this data to determine the state of the project and exercise any control it desires. For this purpose, metrics play an essential role in providing the project management quantified data about the state of development and of the products produced. The software configuration management process deals with the change that is inevitable in a software development project. The development models cannot typically handle change, which can come at any time during development. And changes can have strong effects on cost and quality. Hence, to ensure that the cost and quality objectives are met, the development project is put under the configuration management process. Basically, the process takes change requests, analyzes them, schedules the changes to be done, and then tracks the changes. The basic objective is to see that the cost and quality are not sacrificed by the change activity. This process is typically performed by the configuration control board. The process management process is frequently performed by the software engineering process group. A basic objective of this process is to study the existing process and characterize it so that its expected outcomes are known and can be used for project management. For this, models quantifying expected outcomes for the process are built, based on past projects. The other major activity of this process is to improve the process so that the cost and quality of future products are improved. Process management is an advanced topic that will not be discussed further in this guide. In the rest of the guide we will focus on the various activities that are generally performed during a software development project. That is, the activities that are generally performed in the development processes are discussed in more detail in the rest of the guide. For each activity, some of the activities relating to project management are also discussed. Exercises 1. What are the other (minor) component processes in a software process? Describe the purpose of each. 2. How can you determine if a process is under statistical control for a property of interest (say cost)? 3. What are the major outputs in a development project that follows the proto typing model? 4. Draw a process model to represent your current approach to developing software. 5. Which of the development process models discussed in this section would you follow for the following projects? Give justifications. (a) A simple data processing project. (b) A data entry system for office staff who have never used computers before. The user interface and user-friendliness are extremely important. (c) A new system for comparing fingerprints. It is not dear if the cur rent algorithms can compare fingerprints in the given response time constraints. (d) A spreadsheet system that has some basic features and many other desirable features that use these basic features. (e) A new missile tracking system. It is not known if the current hard ware/software technology is mature enough to achieve the goals. (f) An on-line inventory management system for an automobile industry. (g) A flight control system with extremely high reliability. There are many potential hazards with such a system. 6. It is reasonable to assume that if software is easy to test, it will be easy to maintain. Suppose that by putting extra effort in design and coding you increase the cost of these phases by 15%, but you reduce the cost of testing and maintenance by 5%. Will you put in the extra effort? 7. What are software metrics? What is the role of metrics in project management? What is the role of metrics in process management? 8. Give specific examples of some metrics that can be used to control a software project. 9. Give specific examples of some metrics that can be used to manage and improve a software process. 10. Suppose the relations hip between y and x is of the form y = axb • Given data from past projects, specify how a and b can be determined. 11. Suppose you can measure the number of defects detected during the various reviews and testing. However, the customer requires an estimate of the number of defects remaining at delivery time. How will you build a model to predict this? Assume the existence of any data you need. PREV. | NEXT |