| HOME | Project Management Data Warehousing / Mining Software Testing | Technical Writing |
|
There are two key functions in managing business operations, namely, the exchange and value-added functions. The exchange function coordinates input, whereas value is added by the firm engaged in a series of transformations. The combination of the exchange and value-added functions determines a firm's performance. Another important factor affecting firm performance is the growth of the firm. This section provides empirical evidence to examine the exchange and value-added functions in the container shipping industry. The findings imply that the price on the product market (i.e., freight rate) is positively related to the total production capacity of the industry, but the price on the factor market (i.e., price of ships) is not a significant factor influencing the decision of container shipping firms to adjust their fleet size. 1. Introduction The exchange function and the value-added function are the two key functions in business operations. The exchange function coordinates input, whereas value is added by the firm engaged in a series of transformations. Before the 1930s, business researchers focused on the production function of the firm. The discussion did not extend to the valued-added activities of the firm until the 1950s. Productive efficiency concerns the effective usage of input resources in producing output. In business operations, the cost-minimizing and value-maximizing approaches complement each other. On the other hand, firms possessing extensive resources expand continually not only in their existing fields, but also into new products and new markets as opportunities emerge. Such coordination may involve single or multiple functions and activities. It is the combination of the exchange and value-added functions that will determine a firm's performance. Dunning (2003) added another important point on top of the exchange and value-added functions. He noted that the growth of the existing firm is a key element affecting firm performance. This section illustrates the relevance of the exchange and value-added functions in explaining the business operations of the international container shipping industry. Container shipping is one of the world's most internationalized industries. Container shipping firms, also called liner shipping carriers, provide scheduled, common-carrier-type services over fixed geographical trade routes. The carriers do not have cargoes of their own to transport. Instead, they offer shipping services to transport cargoes for different shippers. Containerization in the 1970s brought a revolution in the pattern of sea transport. Containerization led to a radically new design of container ships and cargo-handling facilities. Carriers also bring structural changes to the container shipping industry through the formation of strategic alliances, enlargement of ship size, and development of global mega firms. All these changes prompt container shipping firms to move towards global operations. This transformation goes further with the continuous trend of internationalization. We discuss a study that used empirical data to examine the exchange function model and the growth of firms, and their implications for firm performance. To carry out the study, we developed the following questions to guide the investigation: • What are the roles of the prices of the input factor and the product factor in the container shipping industry? • How does firm size affect horizontal expansion? • How does firm size affect vertical expansion? • What is the relationship between the growth of firm and firm performance? 2. Exchange Function Firms buy the input factor on the factor market and they sell the output of their value-added activities to customers on the product market. Buyers and sellers interact to determine the prices and quantities of both input and output. The provision of container shipping services to shippers is determined by both the price on the factor market and the price on the product market. In the context of container shipping, the factor market is the new building or the sale and purchase markets, where carriers buy the factor of production (i.e., ships), whereas the product market is the freight market, where carriers provide shipping services to shippers. The product market in container shipping is a marketplace in which sea transport services are bought and sold. Container shipping operates according to a schedule of ports of loading and discharge, adhering to a published timetable on set conditions of carriage. It operates like trains of international seaborne trade , with cargoes made up of a large number of different consignments from different shippers. The freight rate is the price on the product market. The quantity of transport services that carriers are willing to produce and sell depends on the freight rate. The freight rate plays an important role in the provision of a container shipping service. If shippers need more shipping services, shipping demand will rise. When carriers find that ship ping demand exceeds their supply, they respond by increasing the freight rate, which in turn would stimulate an increase in their carrying capacity. On the other hand, firms engage in exchanges along the value chain (i.e., vertically related exchanges) and across the value chain (i.e., horizontally related ex changes). An example of a horizontal exchange in container shipping is the sharing of shipping space. Slot sharing is a way for container shipping firms to share ship ping space with partner carriers to reduce financial risk on capital investment and achieve economies of scale by using larger container ships. This practice allows carriers to place more new building orders for larger container ships owing to their collaborative sharing in areas such as slot sharing and sailing arrangements. An example of a vertical related activity is when a carrier owns its ships by buying them from the factor market. The decision for carriers to engage in a vertical related activity to own their ships is influenced by a number of factors and the strategy differs greatly from carrier to carrier. As shown in Table 1, some carriers own in ex cess of 70% of their entire fleet, whereas others may only own a small percentage. In the factor market, the price of ships serves as a signal to carriers about the status of the supply of and demand for ships to provide shipping services to ship pers. When carriers find that demand for shipping services exceeds their capacity, they buy more ships from either the new building market or the second-hand vessel market, which in turn would stimulate an increase in vessel price. However, a high factor price reduces the demand for the input factor on the basis of the "law of demand". Carriers may reduce their capacity levels when the vessel price on the factor market is high. There are two ways that can be applied to coordinate economic activities: price mechanism and conscious planning. From the perspective of price mechanism, a high vessel price reduces demand for input to provide shipping services, whereas a high freight rate encourages carriers to produce more output for shippers. On the other hand, interfirm cooperation is central to elaborating the concept of conscious planning. Interfirm cooperation refers to a trading relation ship between parties that is stable enough to make demand expectation more reliable, thereby facilitating production planning. There is no specific rule in the container shipping industry to determine how to manage resources. Some carriers prefer to own their ships to ensure stability in the supply of input to provide liner shipping services to their shippers, whereas others may rely on chartering ships from other shipowners. For instance, CSAV obtains 92.1% of its capacity from the chartering market, whereas Girmaldi owns 84.4% of its carrying capacity. To examine the exchange function in the container shipping industry, we used empirical data on fleet size, the freight rate, new building price, and second-hand vessel price in the analysis. Descriptions of the data and the data sources are summarized in Table 2.
Table 2 Data to examine the exchange function in container shipping Table 3 Results of regression analyses To examine the exchange function in the container shipping industry, we evaluated how the price on the factor market and the price on the product market affect the decision of carriers to adjust their fleet sizes. The prices on the factor market are vessel prices, which consist of new building price and second-hand vessel price, whereas the prices on the product market are the freight rates that shippers pay to carriers for transporting cargoes from loading ports to discharging ports. To evaluate how carrying capacity is affected by the prices on the factor market and the prices on the product market, we conducted several regression analyses. The results of the regression analyses are shown in Table 3. In the exchange function, carriers buy the factor input on the factor market by buying ships and sell the output on the product market by charging a freight rate to shippers. The findings indicate that the prices on the factor market do not have a significant effect on carriers adjusting their capacity. On the other hand, the findings show that carrying capacity is significantly affected by the freight rate. Carriers increase their capacity when the freight rate is higher. The higher the freight rate is, the higher is the carrying capacity in the container shipping industry. These findings imply that the price on the product market is an important determinant, whereas the price on the factor market does not have a significant impact on capacity in the container shipping industry. 3. Vertical Expansion Most successful firms grow over the long run. Table 4 presents the evolution of carriers operating fleets from 2000 to 2007. The findings of Tan et al. (2007) demonstrate a positive relationship between operations capability and firm performance. There is a strong tendency for firms possessing extensive resources to continually expand. Productive opportunity is largely determined by the resources of the firm. One of the notable characteristics concerning the growth of firms is the extent to which they change the nature of the products they produce as they grow. The extent to which this process of expansion can continue depends upon the resources of the firm. So long as there are openings in which the firm expects a rate of return on investment sufficient to justify it entering the market, there is nothing in principle to limit its continued expansion. Carriers possessing extensive resources adopt the vertical expansion strategy to control the input by owning their ships instead of chartering ships from other shipowners. To examine the relationship between firm capacity and vertical expansion in the liner shipping industry, we collected data on firm capacity and new orders from the top 100 carriers in 2007. According to Table 5, the results of the regression analysis show that firm capacity and ordering of a new fleet are positively related.
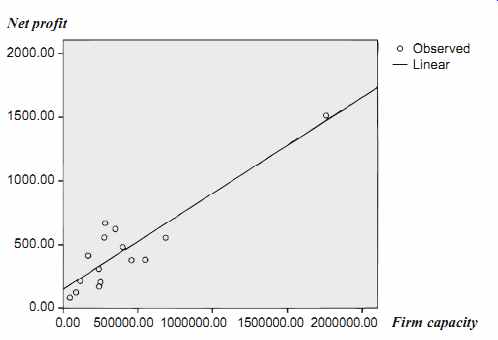
Table 5 Relationship between firm capacity and new orders In Table 5, ß is the coefficient of the independent variable. Using the constant value and the ß coefficient, one can write the estimated regression equation as Expected NO constant FC, ß =+ i.e., NO 37,882.024 0.338FC, =+ where is NO is new orders and FC is firm capacity. In regression analysis, the regression coefficient for a variable tells how much the value of the dependent variable changes when the value of the independent variable varies. A positive coefficient means that the predicted value of the de pendent variable increases when the value of the independent variable increases. The coefficient for the variable of firm capacity indicates the capacity of expected new orders increases by 0.338 TEUs for a growth of 1.00 TEU in firm capacity. 4. Horizontal Expansion Organization size plays a significant role in business research. One of the most common size-based strategies cites low cost derived from economies of scale as a source of competitive advantage. Large size leads to a scale mechanism by which a high production volume can be translated into cost-efficiency. Large size also serves as a strong entry barrier to new competitors. Scale operations provide the means for geographical expansion and facilitate internationalization. Hence, economies of scale provide an advantage both directly by decreasing the per unit cost in the market and indirectly by leading to horizontal expansion. Owing to the advantages of scale operations, the capacity of large carriers has experienced continuous growth. For instance, the capacity of the world's biggest carrier (i.e., Maersk) increased by 284% from 620,324 TEUs in 2000 to 1,759,619 TEUs in 2007. To examine the relationship between firm capacity and horizontal expansion in the liner shipping industry, we collected data on the firm capacity and growth rate of the top 25 carriers in 2007. The sample size of 25 was adequate to represent the liner shipping industry as the top 25 carriers have 84% of the world market share. The summary statistics on firm capacity and growth rate are presented in Table 6. According to the table, the mean value of firm capacity was 351,594 TEUs, with a minimum value of 46,466 TEUs and a maximum value of 1,759,619 TEUs, whereas the mean value of the growth rate was 155.24%, with a minimum value of 15.00% and a maximum value of 458.00%. Table 6 Descriptive statistics of firm capacity and growth rate Table 7 Correlations between firm capacity and growth rate To examine the relationship between firm capacity and growth rate, we constructed the Pearson correlation matrix to examine the direction, strength, and significance of the relationships among the variables used in this study. The results in Table 7 show that there is a positive correlation between firm capacity and growth rate. 5. Growth and Firm Performance Regardless of whether the average profitability of the industry is high or low, some firms are more profitable than others. The relationship between firm size and performance is an interesting topic to explore. One of the most popular size-based strategies is the theory of low cost derived from scale as a primary source of competitive advantage. A firm can be viewed as a collection of resources. An optimal pattern of firm expansion requires a balanced use of internal and external resources. According to Wernerfelt (1984), what a firm wants is to create a situation where its own resource position directly or indirectly makes it more difficult for others to catch up. In the context of container shipping, capacity is one of the resources for potential high returns. Production processes with increasing returns to scale yield high returns. Economies of scale in the use of resources is a prime example of product entry barriers. Nelson and Winger (1982) also noted that "a firm that is already successful in a given activity is a particularly good candidate for being successful with new capacity of the same sort." This routine-based view of growth suggests that expansion will be easier and will lead to better performance. In the container shipping industry, firm capacity has experienced continued growth. It is an interesting issue to explore how firm capacity influences firm performance. We examined the relationship between firm size and firm performance by a regression analysis. In the regression model, the value of net profit was used as the dependent variable and the value of firm capacity in terms of TEUs was used as the independent variable, i.e., predictor. The results of the regression analysis show that firm capacity and net profit are positively related. Using the results in Table 8, one can write the estimated regression equation as Expected NP constant FC, ß =+ i.e., NP 150.217 0.001FC, =+ where NP is new profit (in million US dollars) and FC is firm capacity (in TEUs). The coefficient for the variable of firm capacity predicts that the expected new profit increases by 0.001 for an increase of 1.0 in the value of the firm capacity. This means that the net profit increases by USD 1,000.00 for an increase of 1 TEU in firm capacity. To provide a graphical presentation of the relationship between net profit and firm capacity, we show a curve-fit graph in FIG. 1. The curve-fit graph is a scatter plot of observed values of net profit expectancy and the line is derived from the regression equation.
6. Discussion and Conclusions This section started with an examination of the exchange function in the container shipping industry. The findings suggest that the price on the product market positively affects carrying capacity, whereas the price on the factor market does not have a significant impact on the adjustment of carrying capacity in the container shipping industry. The change in vessel price does not significantly affect the level of the fleet size. In the factor market in container shipping, vessel price is not a significant factor affecting carriers' decisions on adjusting their capacity. On the other hand, ocean carriers tend to increase their capacity when the freight rate is at a high level. The price on the product market (i.e., freight rate) plays an important role in the provision of shipping services. It indicates that container shipping is a market-driven industry as the price on the product market significantly affects ocean carriers' production decisions. Carriers adjust their carrying capacity on the basis of the demand for shipping services. Demand for shipping services depends on shippers' demand for sea transport to consign their cargoes. As a result, seaborne trade is a key determinant that affects the demand for shipping services in the container shipping market. An increase or a decrease in seaborne trade volume would change the demand for shipping services, which in turn influences the freight rate. If the seaborne trade volume in creases, shippers demand more shipping services. When shipping demand exceeds shipping supply, the freight rate will go up. The freight rate coordinates the decisions of carriers and shippers to transact business for shipping services in the container shipping market. A high freight rate tends to encourage growth in carrying capacity. Such an association between the freight rate and the carrying capacity can be regarded as the existence of an invisible hand that controls the container shipping market. Our empirical study also indicates that there is a positive relationship between new orders and carrying capacity in the container shipping industry. This implies that bigger firms tend to use the strategy of vertical expansion. Vertical expansion represents a decision by the firm to utilize internal transactions rather than market transactions to accomplish its economic purpose. In container ship ping, larger firms find it advantageous to own their ships rather than chartering shipping space from other shipowners. Carriers may believe that it is cheaper, less risky, or easier to coordinate their activities when ships are owned internally. A vertically integrated decision is a "make or buy" decision to address the strategic issues of integration or use of market transactions. Vertical expansion has important generic benefits. For instance, vertical expansion to own more ships assures carriers that they will have ships available in tight periods. Growth is related to a firm's requirements for certainty and survival. PREV. | NEXT top of page Home Related Articles |