To fully understand the container shipping industry, it is imperative to identify the factors that influence the capacity of the industry, explain how these factors affect the container shipping market, and empirically test their relation ships grounded in a sound theoretical framework. This section presents such a study built on the industrial organization paradigm that "industry structure determines the conduct of firms whose joint conduct then determines the collective performance of the firms in the marketplace". In this section we interpret a firm's conduct as its organizational choices on key decision variables such as capacity.
On that basis, we identify the factors that affect total fleet size and develop an empirical model of container shipping to explain the relationships among these factors and evaluate their effects on the container shipping market.
1. Introduction
When demand for shipping capacity is uncertain and significant lead times exist for adding capacity, managers of shipping firms must carefully consider their capacity decisions. However, postponing the increase of shipping capacity can lead to the risk of a shipping firm having capacity shortage when shipping demand is expected to grow. A number of studies on capacity management have been reported in the economics and operations research literature. Traditional operations research relies heavily on mathematical modeling and optimization techniques to examine capacity management issues. Nevertheless, it can be useful to develop empirical studies and theories to address operations management issues and to predict the adoption of good practices in the shipping industry. Empirical research is concerned with examining the relation ships between relevant variables by using empirical data for theory building. Kerlinger (1986) defined theory as "a set of interrelated constructs, definitions and propositions that present a systemic view of phenomena by specifying relationships among variables, with the purpose of explaining and predicting the phenomena". Theory can be used to explain observed phenomena by systematically specifying the relationships between constructs. In this section we report on a study that we undertook to develop an empirical model for examining the container shipping industry. Specifically, we developed a container shipping model to determine capacity in the container shipping industry. We began with the industrial organization paradigm that "industry structure determines the conduct of firms, whose joint conduct then determines the collective performance of the firms in the marketplace". We interpret conduct as a firm's choices on key decision variables such as capacity. On that basis, we identified the factors that affect total fleet size in container shipping and developed a container shipping model to explain the relationships among the factors and assess their effects on the capacity of the container shipping industry. We then performed an empirical analysis of the relationships among the factors that affect total fleet size in container shipping.
2. Industrial Organization in Container Shipping
Theory-driven empirical research provides insights and understanding of important issues by using empirical data to build and develop sound theories (Melnyk and Handfield 1998). Industrial organization theory, which takes industry as the unit of analysis, provides a useful theoretical framework for a study of the container shipping market. Identifying the structure of an industry in industrial organization terms casts the spotlight on the various aspects of the industry's environment, which is valuable for understanding the conduct of firms in the industry and predicting their levels of performance that can be reasonably expected.
Industry structure refers to "certain stable attributes of the market that create the competitive context of the industry and influence the firm's conduct in the market place" (Bain 1972). Empirical researchers are concerned with how basic industry characteristics affect the adoption of business operational practices. For shipping managers to make effective decisions, it is important for them to understand the industry structure of the shipping industry. According to the industrial organization paradigm, the performance of the container shipping market depends on both the demand for and the supply of container shipping services, as well as the industry structure. Industry structure affects the characteristics of an industry, particularly the number and size of sellers, the extent of concentration among the seller firms, and the degree of homogeneity of their offerings. As far as its industry structure is concerned, the container shipping industry can be considered as an oligopoly. There are several industrial characteristics in the container shipping business, including (1) high fixed cost, (2) little difference in the services offered, and (3) a few operators accounting for the majority of the total shipping supply. The increase in the carrying capacity of the biggest container shipping operators has accentuated the characteristic of concentrated operation in the industry. For instance, the world's top three shipping firms, i.e., Maersk Line, MSC, and CMA CGM, had collectively increased their global market share to 28% in 2008 in terms of TEU carrying capacity (UNCTAD 2008).
3. Capacity Adjustment in the Container Shipping Market
A market is a collection of firms, each of which supplies products that have some degree of substitutability to the same potential buyers (Koch 1974). A market brings buyers and sellers together to set prices and exchange goods or services. The container shipping market is governed by a mechanism through which the demand for and the supply of shipping services interact to determine the freight rate and fleet size. The freight rate serves as a signal to shipping firms (i.e., carriers) and shippers about the status of supply and demand of container shipping services. If shippers need more container shipping services, shipping demand will rise. When carriers find that shipping demand exceeds their supply, they respond by increasing the freight rate, which in turn would stimulate an increase in the supply of the world fleet. In short, the freight rate coordinates the decisions of carriers to adjust supply in the container shipping market. A higher freight rate is conducive to stimulating growth in shipping capacity. This mechanism can be regarded as an invisible hand that regulates the demand and supply conditions in the container shipping market.
3.1 Seaborne Trade
International trade of general cargo is one of the key factors affecting the demand for container shipping services. World output growth plays a decisive role in determining the volume of container trade. Shipping and international trade are inter related. Ships serve to transport cargo, whereas seaborne trade without ships will come to a halt. A change in the volume of sea borne trade can affect shipping demand as demand for sea transport is derived from demand for goods to be transported. On the other hand, shipping supply depends on two key decision makers, namely, shippers and carriers. Shippers can influence the decisions of carriers on whether or not to increase shipping supply to transport their cargoes.
In examining the container shipping industry, we should consider it not only from a national perspective, but also from a broader view of world development, particularly in the trade sector. Demand for container shipping services is derived from demand for container trade. International trade volume is an important factor that affects the demand for container shipping services. The continuous growth in the world's standard of living strengthens the dependence of the world economy on international trade (Ronen 1983; Brooks 2002).
3.2 Freight Rate
The freight market serves the demand for sea transport. Demand for freight services is a function of the freight rate and quantity demand for shipping services per time period. On the other hand, container shipping supply is a function of price (i.e., freight rate) and quantity supplied (i.e., fleet size) by container shipping firms. The freight market determines the freight rate at the level where shipping demand from shippers is equal to shipping supply. The growth of seaborne trade would lead to a shortage of ships and a sub sequent increase in the freight rate. To tackle the shortage, the container shipping market will adjust by increasing fleet size through placing orders for new ship building. Shipping supply is therefore influenced by the freight rate.
If the freight rate falls, shipping supply is reduced. On the other hand, fleet size is likely to be increased when the fright rate rises.
3.3 Capacity Adjustment
Container shipping is a capital-intensive industry, characterized by a high fixed to variable cost ratio and highly specialized productive capital. Ships are expensive items, the building and acquisition of which require huge capital investment. The return on investment in ships depends on the volume of trade. If ships have been invested in, but trade does not grow as expected, expensive ships will become idle. As demand for ships is derived from seaborne trade, a change in seaborne trade will lead to a change in shipping demand. It is a rational decision for container shipping firms to increase their shipping supply when they are optimistic about the sea cargo volume. Demand for ships reflects the need for container ship ping capacity. Such reflection suggests that a change in seaborne trade affects carriers' decisions on whether or not to expand, and their decisions can influence the supply of world fleet capacity.
Ships are sold and purchased in different markets. The new building market trades new ships, whereas the demolition market deals with old or obsolete ships.
Activities in the new building and demolition markets affect the total container capacity available to transport cargo. The supply and demand mechanism operating in the demolition market is simple. When a carrier considers a ship unsuitable to serve the freight market, the ship could be offered to the demolition market. Such a scrapping decision depends on the container shipping firm's expectation of future operating profits that can be generated by the ship, as well as its own financial position. During a recession, if a container shipping firm believes that there is a slim chance of a freight boom in the foreseeable future, it would likely sell unprofitable ships for scrap. In a period of economic downturn when seaborne trade volume is low, ships are broken up at younger ages. Alternatively, in a boom period when seaborne trade volume is high, container shipping firms would choose to scrap their ships only when the ships are too old to operate.
In a recession period, ships are scrapped at younger ages. Scrapping ships at younger ages reduces the total shipping supply. Scrapping can also be a tool used by container shipping firms to mitigate the problem of overcapacity . On the other hand, container shipping firms are less willing to reduce capacity by scrapping ships at a time of freight boom. The broken-up age of container ships usually ranges between 24 and 30 years (UNCTAD 2005). Container shipping firms can decide when to scrap their ships and use broken-up age as a reference to adjust their fleet capacity.
--------------------

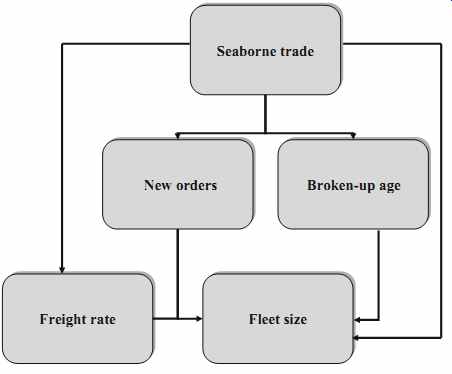
Fig. 1 Capacity adjustment in the container shipping market
Seaborne trade orders Broken-up age Freight rate Fleet size
--------------------

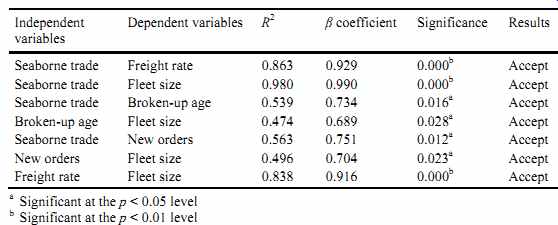
Table 1 Results of regression analyses
3.4 An Empirical Model of the Container Shipping Market
From the previous discussions, we identify that international seaborne trade is key to shipping demand. On the supply side, the decisions of container shipping firms on whether to adjust their fleet sizes depend on the timings of selling ships to the demolition market and of ordering new ships, as well as the volume of international seaborne trade. The freight rate in the container shipping market is influenced by seaborne trade volume. As shown in Fig. 1, factors considered to affect fleet size include broken-up age, new orders, seaborne trade, and world fleet.
To empirically test this research model on capacity adjustment in the container shipping market, we used 10 years of data, from 1995 to 2004, collected from Clarkson Research Studies, the Review of Maritime Transport, and the Bureau of Labor Statistics. Details of the data sources can be found in the Appendix. The research model identifies the factors that affect fleet size in the container shipping market.
To validate this model on capacity adjustment in the container shipping market, we used multiple regression as the analytical tool. A summary of the statistical relationships among the study variables in the capacity adjustment model and the regression coefficient (ß) is reported in Table 1. The regression coefficient indicates the degree to which each predictor variable is explained by other predictor variables. Regression coefficients provide information about the functional relationships between pairs of variables, predicting how much the dependent variable changes with a given change in any of the different causal variables.
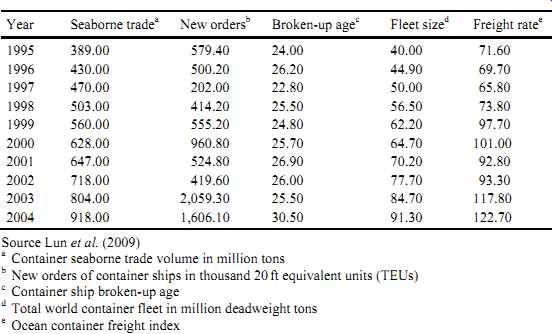
As shown from the data sources, fleet size experienced continuing growth from 40.00 million deadweight tons in 1995 to 91.30 million deadweight tons in 2004.
From our regression analyses, we found empirical support for the positive effects of four variables (factors) on fleet size and these factors were seaborne trade, the freight rate, new orders, and broken-up age.

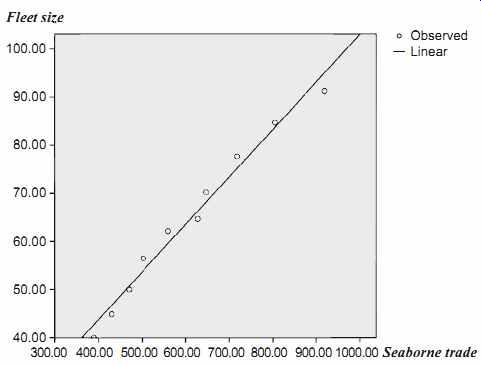
Fig. 2 A scatter plot of fleet size and seaborne trade in container shipping
4. The Determinant of Fleet Size in Container Shipping
In container shipping, fleet size has experienced continued growth in recent years.
According to the results from the regression analyses, seaborne trade is a key determinant affecting fleet size. To understand how the determinants affect fleet size, we developed a scatter plot and regression equation to examine fleet size in container shipping.
Figure 2 shows the scatter plot of fleet size and seaborne trade in container shipping. Scatter plots are a type of display to demonstrate values for two variables for a set of data. The data are displayed as a collection of points, each having the value of seaborne trade volume on the horizontal axis and the value of fleet size on the vertical axis. As shown in Fig. 2, the pattern of dots slopes from the lower left to the upper right, suggesting a positive correlation between the variables being studied.
The coefficients (ß) of the independent variables that affect fleet size are listed in Table 2. On the basis of the regression results, we obtained the following regression equation for predicting fleet size:
FS 4.263 0.099ST, =+
where FS is fleet size and ST is seaborne trade.
In the regression equation, seaborne trade is the indicator of fleet size in the container shipping market. ß (i.e., 0.099) in the equation has a positive value, meaning that the predicted value of the fleet size increases when the value of seaborne trade increases. The regression equation indicates that shipping capacity will increase by 1 ton with a growth of 10.10 tons of seaborne trade in the container shipping market. Hence, the ratio of increase in shipping capacity (in terms of tons) to growth in annual seaborne trade (in terms of tons) is approximately 1:10.

Table 2 Results of regression analysis
The results show that the ratio of growth of shipping capacity to growth in annual seaborne trade is 1:10 in container shipping. In section 3, we found that the ratio of growth in shipping capacity relative to growth in annual seaborne trade is 1:20 in bulk shipping. Hence, the capacity requirement of container shipping is much higher than that of bulk shipping. The higher requirement for shipping capacity may be caused by the complex shipping operations. For instance, containers may transship at hub ports from ports of origin and therefore extra shipping capacity may be required. Another reason for the higher space requirement is attributable to the need for shipping empty containers from the areas of demand owing to imbalance of trade.
5. Discussion and Conclusions
The literature has suggested that seaborne commodities trade affects the demand for container shipping services. In our study on the determinants of fleet size in container shipping, container shipping demand, which is derived from seaborne trade volume, was identified as a key determinant.
The result indicates that seaborne trade has a greater impact on fleet size than on the freight rate. Growth in seaborne trade provides incentives for ship operators to adjust their fleet sizes in response to the corresponding increase in shipping demand. Seaborne trade also affects the freight rate, but the magnitude in terms of ß is smaller than that of fleet size. Furthermore, change in seaborne trade would lead ship operators adjusting their fleet sizes with respect to their decisions on broken up age and ordering of new ships.
In our capacity adjustment model, the freight rate is another important factor that affects fleet size. Seaborne trade also positively affects fleet size. In comparing the magnitudes of their effects on fleet size, we found that seaborne trade (ß = 0.990) has a stronger effect than the freight rate (ß = 0.916). Our result indicates that ship operators consider cargo availability to fully utilize shipping spaces more important than the potential revenue generated from the freight market in deciding their shipping supply. In the last decade, growth in fleet size was mainly prompted by an increase in seaborne trade volume.
There are several factors influencing the supply of container services and these include seaborne trade, the freight rate, ordering of new ships, and scrapping of old ships. From the test results, fleet size is affected by seaborne trade (with ß = 0.990), the freight rate (with ß = 0.916), new orders (with ß = 0.704), and broken-up age (with ß = 0.689). In the container ship ping market, supply of the world fleet varies when demand for sea transport changes. Such a market mechanism determines the fleet size available in the container shipping market. Shipowners control the supply of their container capacity.
They respond to changes in seaborne trade volume by either scrapping old ships or ordering new ships. Our findings suggest that trade booms will lead to high bro ken-up ages since container operators tend to be hesitant in taking their ships to the demolition market. It also explains why broken-up age has a significant impact on world fleet size. To increase container shipping supply, new orders are placed by container operators when world trade prospers.
The implications of the study results are twofold, which can be drawn from the perspectives of both researchers and managers. From a research perspective, our empirically tested container shipping market model identifies the factors that collectively affect fleet size in the container shipping market. Our empirical model suggests that seaborne trade is a key factor that affects container operators in adjusting their fleet sizes through ordering and delivery of new ships, and scrapping of old ships. Seaborne trade also influences the freight rate. It implies that sea borne trade is the most important determinant of fleet size in the container ship ping market. With changes in seaborne trade volume, container operators adjust their shipping supply through various measures such as adding new ships and scrapping old ships. Our findings that the effect of seaborne trade is higher than that of the freight rate on capacity adjustment implies that shipowners would place a greater emphasis on cargo volume than the potential revenue generated from an increased freight rate when they determine their fleet sizes.
From a management perspective, our findings indicate that there are a number of determinants of fleet size in the container shipping market, which include seaborne trade, the freight rate, new orders, and broken-up age of ships. This study provides an insight into the relationships between the variables of seaborne trade and freight rates, seaborne trade and size of the world fleet, as well as the freight rate and size of the world fleet. Our results explain the important roles of international trade and the freight rate in the shipping industry. The freight rate is critical in generating revenues for shipowners, and seaborne trade is significant in providing cargo to feed the ships. The importance of seaborne trade in container shipping implies that ship managers may need to acquire knowledge in economics and trade development to make better decisions on adjusting their fleet sizes. Our empirical model illustrates that fleet size can be adjusted in response to changes in seaborne trade volume. Our study advances knowledge on the key elements that affect the demand for container shipping services, the supply of container shipping services, and the freight rate. Stakeholders in the container shipping industry, which include bankers, shipbrokers, shippers, shipbuilders, and ship scrappers, can benefit from a better understanding of the determinants of fleet size, and how ship managers adjust their fleet sizes in the container shipping market.

Table 3 Data used for examining capacity adjustment in the container
shipping market
Appendix
To test the research model, we used 10 years of data, from 1995 to 2004, collected from Clarkson Research Studies, the Review of Maritime Transport, and the Bureau of Labor Statistics. Clarkson Research Studies provides statistical services to shipbrokers and the shipping industry. The research team at Clarkson Research Studies compiles data on the world's bulk, container, and general cargo fleets comprising some 30,000 vessels on a daily basis. The Review of Maritime Transport is one of the United Nations' flagship publications, published annually since 1968. It reports the worldwide evolution of shipping, ports, and transportation related to the major traffic of liquid bulk, dry bulk, and container shipping. The Bureau of Labor Statistics is the principal fact-finding agency for the US Federal Government in the broad field of labor economics and statistics. The Bureau of Labor Statistics is an independent national statistical agency that collects, processes, analyses, and disseminates essential statistical data to the public. Bureau of Labor Statistics data satisfy a number of criteria for data quality, including relevance to current social and economic issues, timeliness in reflecting today's rap idly changing economic conditions, accurate and consistently high statistical quality, and impartiality in both subject matter and presentation.
The data are summarized in Table 3 above.
Also see: Guide to Global Logistics
top of page Home Related Articles
