Data Mining and Data Warehousing in Biology, Medicine and Health Care
TABLE OF CONTENTS
1. INTRODUCTION
2. BIO-TECHNOLOGY RESEARCH: The Genome and other Applications
1. INTRODUCTION
2. BIO-TECHNOLOGY RESEARCH: The Genome and other Applications
ii. The European Bioinformatics Institute (EBI) and the European Molecular Biology Laboratory (EMBL)iii. GeneCards
c. Companies
7. APPENDIX
The gains from successful practices of data warehousing (the definition of a “data warehouse” can be vague; for this paper, this definition will be used) and data mining are unprecedented in business and industry. But if purely business needs and decisions are the primary uses of these practices, then surely biology, health and medicine are second in line. The completion of the mapping of the human genome in summer of 2000 – a.k.a. the Human Genome Project -- has given researchers a wealth of information to “dig” through. This information – which consists of 30,000 – 35,000 genes in human genomes -- is only considered useful or interesting if it can be mined for the purposes of extracting data relevant to a specific task. Indeed, many data warehouses of biological information have begun to proliferate – all waiting to be analyzed or mined for the welfare of humanity. In the health care sector, public and private organizations have launched extensive data-warehouse and data-mining projects. It is hoped that these efforts will project and control health care costs, track diseases, patients and physicians, and improve overall treatment and care for the ill. New technology also imposes some ethical dilemmas, such as the usage and privacy of genetic and medical data. This article will seek to examine topics in data mining and data warehouses in biology, medicine and health care.
The biological sciences contain an enormous amount and variety of information: environmental science, ecology, anatomy, botany, etc. Genetics is an especially suitable candidate for the application of information technology (IT). Stated simply, it can be thought of as the construction of models based on information about genes (the basic units of heredity) and populations seeking relationships out in that information. The field of genetics can be divided into three sub-groups: Mendelian genetics – study of transmission of traits between generations; molecular genetics -- study of chemical structure and function of genes at a molecular level; and population genetics – studies of how genetic information varies across populations of organisms. Of these three, molecular genetics is the most challenging, due to the detailed complexity of the composition, structure and function of genes. The staggering volume of molecular data and its cryptic and subtle patterns have led to an absolute requirement for computerized databases, warehouses and analytical tools. The challenge is in finding new approaches to deal with the volume and complexity of data, and in providing researchers with better access to analysis and computing tools in order to advance understanding of our genetic legacy and its role in health and disease. In addition to genetics, the “next-step-up” called protenomics – the study of proteins that are constructed according to genetic blueprints – is also a field of great interest and contains unparalleled challenges in information sciences.
Managing biological information is quite challenging due to the many special characteristics that biological data exhibits. The term bioinformatics defines the multidisciplinary nature of biological information. Bioinformatics addresses information management of genetic information with special emphasis on DNA sequence analysis. Its definition can be broadened into a wider scope to make use of all types of biological information: modeling, storage, retrieval and management. The following is a list of specific characteristics and challenges that databases and warehouses must address:
-Biological data is very complex when compared to most other domains or applications. Definitions of such data must therefore be able to represent a complex substructure of data as well as relationships and to ensure that no information is lost during biological data modeling. Biological information systems should be able to represent any level of complexity in any data schema, relationship, or schema substructure – not just hierarchical, binary or table data. MITOMAP is an example of a database that documents the human mitochondrial genome. This single genome is a small, circular piece of DNA that contains information of about 16,569 nucleotide bases; 52 gene loci encoding messenger RNA, ribosomal RNA, and transfer RNA; 1000 known population variants; over 60 known disease associations; and “a limited set of knowledge on complex molecular interactions of biochemical energy producing oxidative phosphorylation” 2. Due to this high level of complexity, managing this database has proven difficult using traditional RDBMS or ODBMS approaches to capture data, much less to perform OLAP.
-The amount and range of variability in data is high. Therefore, biological data systems must be flexible in handling data types and values. With the huge range of possible data values, placing constraints on data types must be limited because this may exclude unexpected values – e.g., outlier values – that are commonly found in the biological domain. Exclusion of such values in mining practices may result in the loss of vital information.
-Schemas in biological databases and warehouses change at a rapid pace. So, for better information flow between generations or releases of databases, schema evolution and data migration object must be supported. The ability to extend the schema, a frequent occurrence in biological environments, is currently unsupported in most relation and object database systems. The popular database (and data warehouse) Genebank (which will be discussed later) re-releases the entire database with new schemas once or twice a year rather than incrementally updating the system as it becomes necessary.
-Representations of the same data by different scientists will likely be different (even when using the same system). Therefore, there must be some way of “aligning” the different biological schemas, or different versions of schemas should be supported. Due to the complexity of biological data, there are many ways of modeling any given entity, with results that often reflect the particular focus of the scientist. Two individuals may produce different data models; but these models will have many points in common. A proposed solution is to link data elements in a network of schemas.
-Most users of bio-data do not require write access to the database or warehouses; read-only access is adequate. Write access is only given to privileged users called curators. This is due to the fact that biologists are not computer scientists. The MITOMAP database project has 30,000 or more users every month; less than twenty are write submissions.
-Most scientists are not likely to know the internal structure of the DB/DW or about schema design. Biological database, data-warehouse and data-mining interfaces should present information in a manner to that is applicable to the problem they are trying to solve and that reflects the underlying data structure. Biological users usually know which data they need but no technical background of data structures or how DBMS, warehouses and mining systems represent data. They rely on technical users to provide them views into the database.
-The context of data gives meaning for its use in biological applications. Therefore, context must be maintained and conveyed to the user when appropriate. Also, it should be possible to “integrate as many contexts as possible to maximize the interpretation of a biological data value.” Isolated values are of little use. For example, a strand of DNA is of little use if additional information describing its organization, function, etc. are missing. A single nucleotide on a DNA strand, seen in context with non-disease causing strands, could be seen as the root cause of a major disease.
-Defining and representing complex queries is very important to the biologist. This means biological systems must be able to support complex queries. As stated previously, most research scientists are not capable of writing complex queries themselves. Hence, systems must provide tools for building queries or come with predefined query templates.
-Users of bio-data often require access to “old” values of the data – particularly when verifying previously reported results. Therefore, changes of values to the data in the database or data warehouse must be supported through a system of archives. Access to both the most recent version of data value and its previous version are important in the biological domain. Scientists consistently want to query the most up-to-date data, but they must also be able to reconstruct previous work and re-evaluate prior and current information. Hence, values that are about to be updated in a biological database or warehouse cannot just be deleted.
“Now that the draft human genome sequence is available, everyone wants to be able to use it. However, we have perhaps become complacent about our ability to turn new genomes into lists of genes. The higher volume of data associated with a larger genome is accompanied by a much greater increase in complexity. We need to appreciate both the scale of the challenge of vertebrate genome analysis and the limitations of current gene prediction methods and understanding.” - Nature Vol. 409 15 February 2001. 15
The challenge to organize biological information is truly great, and much of the technology is, admittedly, in its infancy. However, remarkable efforts have been made in the last dozen years to help scientists make sense of the vast amount of data attained thus far. At the forefront of bioinformatics is the US government’s NCBI (National Center for Biotechnology Information), a division of the National Library of Medicine (NLM) at the National Institutes of Health (NIH). NLM was chosen for its experience in creating and maintaining biomedical databases and warehouses, and because as part of NIH, “it could establish an intramural research program in computational molecular biology.” Collectively, the NIH makes up the largest biomedical research facility in the world.
Established in 1988, NCBI’s mission is to develop new information technologies to assist in the understanding of fundamental molecular and genetic processes that control health and disease. Specifically, NCBI has assumed the responsibility of creating automated systems for storing and analyzing knowledge about molecular biology, biochemistry, and genetics; facilitating the use of such databases, data warehouses, and software by the research and medical community; coordinating efforts to gather biotechnology information both nationally and throughout the world; and performing research into advanced methods of computer-based information processing for analyzing the structure and function of biologically important molecules.
Specific NCBI databases and/or data warehouses and data mining software include:
GenBank: GenBank (part of the International Nucleotide Sequence Database Collaboration) is the NIH genetic sequence database, an annotated collection of all publicly available DNA sequences. There are approximately 13,543,000,000 bases in 12,814,000 sequence records as of August 2001. For example, you look at the record for a Saccharomyces cerevisiae gene. The complete release notes for the current version of GenBank are available. A new release is made every two months. GenBank is part of the International Nucleotide Sequence Database Collaboration, which is comprised of the DNA DataBank of Japan (DDBJ), the European Molecular Biology Laboratory (EMBL), and GenBank at NCBI. These three organizations exchange data on a daily basis. The data in GenBank is free and available to the entire scientific community worldwide. 17
Online Mendelain Inheritance in Man (OMIM): This database is a catalog of human genes and genetic disorders authored and edited by Dr. Victor A. McKusick and his colleagues at Johns Hopkins and elsewhere, and developed for the World Wide Web by NCBI, the National Center for Biotechnology Information. The database contains textual information and references. 17
Unique Human Gene Sequence Collection (UniGene): UniGene is an experimental data mining system for “automatically partitioning GenBank sequences into a non-redundant set of gene-oriented clusters.” 17 Each UniGene cluster contains sequences that represent a unique gene, as well as related information such as the tissue types in which the gene has been expressed and map location. In addition to sequences of well-characterized genes, hundreds of thousands of novel expressed sequence tag (EST) sequences have been included. Consequently, the collection may be of use to the scientists as a resource for gene discovery. UniGene has also been used by researchers to select “reagents for gene mapping projects and large-scale expression analysis.” However, it should be mentioned that the procedures for automated sequence clustering are still under development and the results may change from time to time as improvements are made. 17
Entrez: NCBI's search and retrieval system that provides users with integrated access to sequence, mapping, taxonomy, and structural data. Entrez also provides graphical views of sequences and chromosome maps. A powerful and unique feature of Entrez is the ability to retrieve related sequences, structures, and references. The journal literature is available through PubMed, a Web search interface that provides access to the 9 million journal citations in MEDLINE and contains links to full-text articles at participating publishers' Web sites. Entrez effectively searches GenBank, OMIM, UniGene and other databases and servers as the central search system at NCBI. The figure below illustrates how Entrez operates as search and OLAP engine with the NCBI’s various databases – i.e., the NCBI data “warehouse”. 17
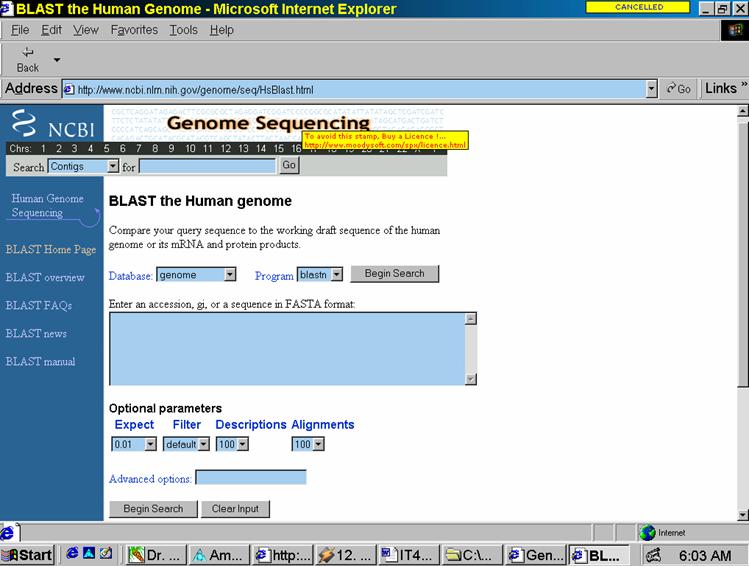
Basic Local Alignment Search Tool (BLAST): A basic data mining program for sequence similarity searching developed at NCBI, and is used in identifying genes and genetic features. BLAST can execute sequence searches against the entire DNA database in less than 15 seconds. Fig. 1 in the Appendix shows the BLAST Web-based interface. There are several programs within BLAST (see http://www.ncbi.nlm.nih.gov/Education/BLASTinfo/query_tutorial.html) that allow one to enter compare different types of data. Then one opens the search page and selects databases used in comparisons (databases fall under two categories: proteins and nucleotides). Lastly, one enters the sequence itself into the text field in one of three formats: FASTA sequence format, NCBI Accession numbers, or GIs. FASTA seems to be the most popular of these formats. Then, one clicks the “Submit Query Button" and the results are displayed in the returning HTML page. 17
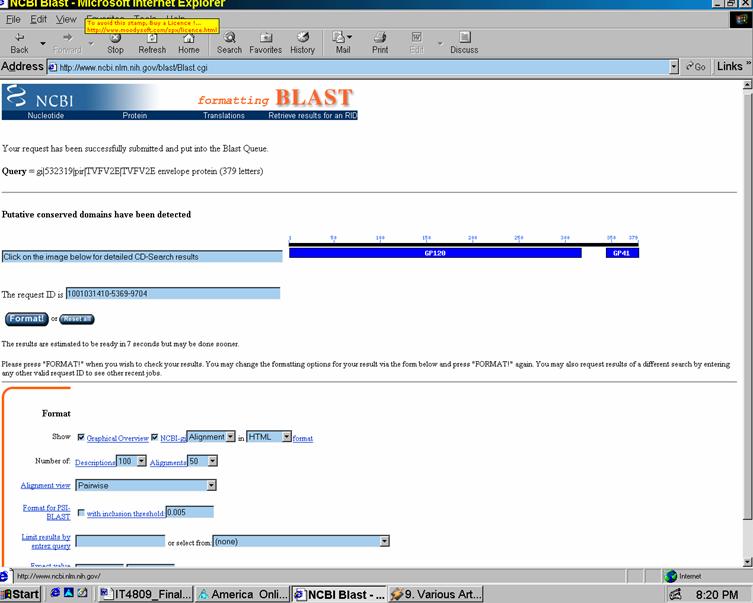
As an example, I entered the following glyco-protein sequence into the program blastp:
>gi|532319|pir|TVFV2E|TVFV2E envelope protein
ELRLRYCAPAGFALLKCNDADYDGFKTNCSNVSVVHCTNLMNTTVTTGLLLNGSYSENRT
QIWQKHRTSNDSALILLNKHYNLTVTCKRPGNKTVLPVTIMAGLVFHSQKYNLRLRQAWC
HFPSNWKGAWKEVKEEIVNLPKERYRGTNDPKRIFFQRQWGDPETANLWFNCHGEFFYCK
MDWFLNYLNNLTVDADHNECKNTSGTKSGNKRAPGPCVQRTYVACHIRSVIIWLETISKK
TYAPPREGHLECTSTVTGMTVELNYIPKNRTNVTLSPQIESIWAAELDRYKLVEITPIGF
APTEVRRYTGGHERQKRVPFVXXXXXXXXXXXXXXXXXXXXXXVQSQHLLAGILQQQKNL
LAAVEAQQQMLKLTIWGVK
The code consists of the ubiquitous ACGT nucleic acids; other letters denote different combinations of these acids or other functions (see FASTA for more details). The results obtained are illustrated in Figures 2a and 2b of the Appendix.
Other than the remote Web interface at NCBI, BLAST can work locally on one’s personal computer or server. Called Standalone BLAST, the executable files can be downloaded from NCBI’s FTP server. Copies of the various databases mentioned can also be downloaded.
All of
NCBI's databases and software tools are available from the WWW or by FTP.
NCBI also has e-mail servers that provide an alternative way to access
the databases for text searching or sequence similarity searching.
The EBI/EMBL is part of the International Nucleotide Sequence Database Collaboration as is NCBI’s GenBank. EBI/EMBL have databases and tools similar to that of NCBI.
One such tool is FASTA33, a data mining tool similar to BLAST. The Web interface for which is shown in Fig. 3. I ran the similar glyco-protein FASTA query sequence into FASTA33. The results took much longer to compile (3-4 minutes as opposed to 15sec for BLAST). However, the FASTA33 outputted a much greater amount of data – the results of which cannot be shown due to the size. The data was not as well formatted as that of BLAST, lacking color coding of specific sequences.
It is unnecessary to list EMBI’s other tools, functions, and resources due to their similarity to those of NCBI.
There are some noble efforts to provide pre-mined information via web-accessed databases. The most ambitious of these efforts may be the GeneCard project from The Weizmann Institute of Science of Rehovot, Israel. Although NCBI remains the most complete bioinformatics resource, it is by no means the only resource. The goal of GeneCards is to integrate the sheer number of different sources into one Web-accessible knowledge base – a kind of “Matrix for biological knowledge.” 21 This ‘matrix” is what the Weizmann Institute calls its GeneCard Encylopedia, or, simply GeneCards.
GeneCards is a database of human genes, their products and their involvement in diseases. It is to be used as a model to develop computational tools that may help to establish an electronic encyclopedia of biological and medical information based on intelligent knowledge navigation technology and a user-friendly presentation of information that makes use of current Human-Computer Interaction research. 21
An important aspect of the GeneCards strategy is to make use of standard nomenclature, esp. approved gene symbols. The data in the GeneCards Encyclopedia database is mined from various databases and data warehouses around the world. These sources include previously mentioned resources such as NCBI’s UniGene, GenBank, OMIM and PubMed. A complete listing of data sources may be found at this URL: http://bioinfo.weizmann.ac.il/cards/background.html#where. 21
The encyclopedia is broken up into individual GeneCards that are topic specific. For example, GeneCards are available on specific topics such as disorders and mutations, sequences, coordinates, research articles, medical applications and many more. The individual GeneCards, which thus integrate some knowledge about a particular gene and its product(s), and which provide fast access to further information, may be accessed by using the search engine, which is accessible from many points in the database. What is special about this search engine is that it returns “verbose extracts of the data that may be relevant, and that it highlights those words that matched the query.” Thus, by browsing through these extracts, the user may quickly select the GeneCards that may be most interesting, without losing time by clicking into things that have no relevance. 21
How was the GeneCards database built? Most of the associated work is done automatically by scripts developed in Weizmann’s group that are written in PERL. The results returned by them are analyzed for relevance, and extracts from these data are made that are subsequently stored in GeneCard source files. After a checking script searches those preliminary GeneCards for errors, they are transformed into active entries of the database.
Weizmann’s next step is to develop tools that will guide the user in an intelligent way to the information he or she requested, and the preliminary results of this work have been introduced into the search engine of the GeneCards database. For example, if your search does not produce any result, the database suggests strategies for improving your search that are based on what you have entered. In addition, direct links to search engines of other databases are given, and based on the short descriptions of the GeneCards-related information that can be found there, the user may rapidly find the database appropriate for his/her query.
With the biomedical databases filling, the next step is to find out what the genes really do, either by “measuring the activity of panels of genes (e.g. with so-called 'biochips'), or by analyzing the cell's protein complement, the proteome (usually with two-dimensional electrophoresis)”. These activities are often called as Functional Genomics, a new field that tries to efficiently use the products of the Genome Program to conduct gene function experiments on a genome-wide scale. One important result of these studies is that large amounts of data will be produced that require new methods for analysis, including tools for data mining. The development of software tools for the extraction of textual information about the functions of human genes from distributed Internet resources, for example, is a key aspect of the GeneCards Project. 21
There are several free and commercially-produced genetic/protenomics mining tools that run locally on one’s computer or server. These programs often offer greater functionality than either BLAST or FASTA33. One such free tool is GeneMine. Created at UCLA by C. Lee and K. Irzzary, the GeneMine system provides:
(1) automated analysis of DNA (deoxyribonucleic acid) and protein sequence data using over 50 different analysis servers via the Internet, integrating data from homologous (similar structure) functions, tissue expression patterns, mapping, polymorphisms, model organism data and phenotypes, protein structural domains, active sites, motifs and other features, etc., (2) automated filtering and data reduction to highlight significant and interesting patterns, (3) a visual data-mining interface for rapidly exploring correlations, patterns, and contradictions within these data via aggregation, overlay, and drill-down, all projected onto relevant sequence alignments and three-dimensional structures, (4) a plug-in architecture that makes adding new types of analysis, data sources, and servers (including anything on the Internet) as easy as supplying the relevant URLs (uniform resource locators), (5) a hypertext system that lets users create and share “live” views of their discoveries by embedding three-dimensional structures, alignments, and annotation data within their documents, and (6) an integrated database schema for mining large GeneMine data sets in a relational database. “The value of the GeneMine system is that it automatically brings together and uncovers important functional information from a much wider range of sources than a given specialist would normally think to query, resulting in insights that the researcher was not planning to look for.” 24
GeneMine designers argue that Web-based bioinformatics tools, such
as BLAST and FASTA33 fall under the category of “expert model”. This means
that the scientists must be able to think of the proper query, decide if
it’s worth the effort, and decipher the complex and often voluminous results. A less-expert user might not even be aware of what queries are possible. Although this Web model made data much more broadly available and useful, the
basic modes of querying the data (e.g., BLAST, the Basic Local Alignment Search Tool) have remained largely unchanged. Whereas
genomics data have made dramatic orders-of-magnitude advances, most biologists
are querying and analyzing those data in much the same ways they did five
years ago. 24
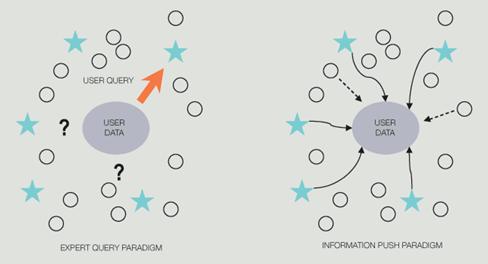
GeneMine aims to overcome these challenges by focusing on three broad areas. First, Lee and Irzzary opted to focus on information visualization, providing an interactive, visual tool for human scientists to make and validate discoveries, as opposed to automated data-mining programs for computers to make discoveries (e.g., Bayesian methods for polymorphism discovery). GeneMine is designed to assist scientific inference from multiple lines of evidence for problems that still require human intelligence. At this early stage in bioinformatics, most real questions have this character. “Such problems demand an exploratory tool that exposes patterns to the scientist's perception and facilitates rapid exploration of hypotheses.” 24 Second, GeneMine deploys a client-side approach to heterogeneous data integration, as opposed to heavier-weight server-side strategies used in many other successful systems. The client-side approach fits especially well to a visual, interactive tool. Third, given researchers' unfamiliarity with data mining and bioinformatics, Lee and Irzzary decided to use an information push model instead of the conventional pull mindset assumed in Web or database query systems (see diagram below). GeneMine uses query and data-mining automation to push relevant information from many sources into the users' view for the specific genes on which they are working. This is achieved via layers of automation and data-mining techniques (data aggregation and filtering, drill-down, cross-validation). 24
Expert Query vs. Information Push paradigms. 24
The most appealing feature of GeneMine is its interactive
visual mining tool. Bioinformatics poses special challenges to data-mining methods: here scientists
analyze the application of “classic approaches” such as association rules,
decision trees, clustering, and multidimensional analysis to bioinformatics problems. A key issue in biological databases is their extreme
diversity and the enormous breadth of data types, ranging from clinical
patient databases and population genetics data to genome sequence and expression
data, to chemical structure and activity databases (to name just a few).
Seeking association rules in such a complex data set scales, or worse,
when one considers all possible pairs of data types or higher-order combinations
can be a daunting task. Fortunately, this “galaxy of data types can be
resolved into a simple star topology” by taking advantage of the central
role of DNA in biology. Since nearly all biological activities, structures, and properties
come from one or more genes, these data can be reorganized to use the gene
sequence as a “hub” that connects all the diverse data.
The visual data-mining environment of GeneMine is organized on this
principle see Fig. 4 in the Appendix.. Its sequence window seen at the bottom of the figure is the central starting point for nearly all
analysis, where DNA and protein sequences, as well as annotations from GeneMine, are shown. Around
this window are the structure window at upper left (for three-dimensional atomic structure and molecular modeling) functional annotations (function features associated with specific residue(s) of sequences), and the information window at upper right (for drill-down, browsing, and user hypertext documents containing
embedded views of the three previous kinds of data). These views are completely
interconnected; any action in one is reflected in all, allowing users to
“perceive and explore the detailed association rules of all the data through
their interconnection in the gene sequence.” 24
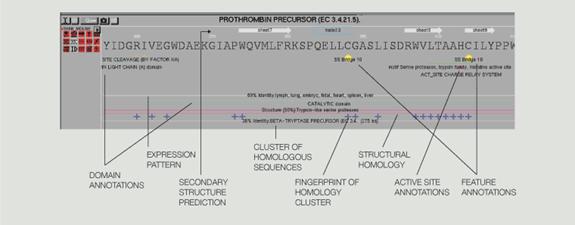
GeneMine is also unique in the range of information types that it
draws together in “an integrated visual mining interface, using the annotation metaphor to attach any kind of information to specific locations in a sequence.”
Due to the fact that nearly all biological activities ultimately attach to
an individual gene, and frequently to a specific range or “individual residue”
within that gene, “annotations provide a very general mechanism for integrating
extremely diverse types of data from different sources” (Fig. 5 in Appendix). In the figure, the distinct types of data found for a given sequence
are displayed as small icons beneath the name of the sequence (at left).
The user can turn the display of each annotation type on or off by clicking
the icon or show or hide individual annotations in any combination. An important
design goal was to include information all the way from the genomic DNA level (the blueprint for the organism) “to its expression as working proteins,
with their complex structure-function relationships.” The current annotation
types of GeneMine include “genetic features (e.g., physical or genetic mapping,
polymorphisms, open-reading frames, exons or introns), protein structure
features (e.g., domains, secondary structure, disulfide bridges), functional
features (active site or binding site residues, functional motifs), homology
relationships or patterns, gene expression information, model organism data,
disease associations, and literature links from SWISS-PROT (protein database developed in Switzerland), GenBank, PROSITE (database of protein families and domains), OMIM (On-line Mendelian Inheritance in Man), FlyBase, and other databases”. The ability
to integrate these diverse data draws not only on the advantages of the lightweight
client architecture of GeneMine but also on the tremendous efforts throughout
the bioinformatics community to make data available via the Web. 24
The visual data-mining capabilities of GeneMine allow researchers to rapidly explore the patterns and interconnections within the data that frequently suggest a functional hypothesis and provide a number of separate pieces of data for validating the hypothesis. Association rules can be revealed by annotation roll-up or drill-down using the sequence as an information hub. GeneMine shows icons next to each sequence representing the types of information it has discovered. Users can independently toggle each of these classes of data with a single click, giving them easy, intuitive access to the 2N possible rollups of annotation data.
Aggregation and clustering for multidimensional analysis are other
essentials in bioinformatics data mining. The volume of results from bioinformatics
analyses can be overwhelming, and the volume itself can obscure the important
patterns in the data. The redundancy (repetitions of information that are
really so similar as to be effectively the same) and noise (unreliable data)
common in bioinformatics results promotes a “lazy” evaluation style in which
scientists try to find a single “good hit” and ignore the rest of the “lower
quality” information. However, this style “deprives the scientist of many
deeper patterns and unexpected insights that can be extracted from the mass
of data.” GeneMine attempts to automate this analysis through a combination
of filtering (to remove noise), clustering (to reduce redundancy), and pattern
analysis (to elucidate large-scale patterns within the total set of data).
Information in GeneMine is distilled through a series of levels. First, results are filtered for significance. An
expectation score is attached to every result, and the user can freely adjust
the threshold for showing or hiding results with lesser confidence levels.
Second, “homology results are clustered into families, typically producing
an order of magnitude reduction.” Third, the total set of annotations for
each sequence are “condensed by type via a set of clickable icons for each type, e.g., [see Fig 4 ], secondary structure, homology, polymorphisms, three-dimensional (3-D) structure, identity match; conservation fingerprints; disease associations.”
Clicking each icon can either toggle the display of all annotations of that
type for the sequence, or show a list from which the user can select. These
annotation type icons show what kinds of information GeneMine has found,
without taking up space with annotations the user currently does not wish
to view. 24
OLAP operations such as drilling down are also essential in a tool
such as GeneMine. GeneMine condenses information in its initial display,
but preserves the links necessary for pursuing any piece of information that
the user finds interesting. In Fig. 4, for example, the user might be interested in learning more from the 3-D structure icon that appears next to the sequence name. Clicking this icon brings
up “annotations on the amino acid sequence marking regions of homology to
known structures, e.g., ‘viral coat and capsid proteins.’” Clicking on one
of these annotations brings up a list of all the homologous sequences detected
in this family, in this case (as shown in Fig 4) a list of seven sequences from PDB (Protein Data Bank) structures, with detailed statistics about their level and extent of homology, FASTA score, expectation score, etc. Another link shows in full detail the raw FASTA search results from which these hits were extracted. Each of the seven sequences
in the list can also be clicked for a further drill-down menu with links
to the structural classification of that protein (from the SCOP database), information about its PDB structure, its ligands, etc., and a link to download this structure into GeneMine.
Since the information window in GeneMine is a simple Web “browser,” these
links can take advantage of any useful information sources on the Internet.
“Downloading the structure immediately displays its atomic coordinates and
its amino acid sequence(s) in GeneMine, which will in turn launch a new cycle
of automated alignment, analysis, and annotation of these new sequences.
Briefly, each new piece of information “leads seamlessly to many more sources
of information; the user can easily browse these sources as deeply as he
or she wants, expanding or collapsing the view of various kinds of information
to explore different aspects of a problem without ‘losing the connection’
to the other kinds of information that have been gathered.” 24
Finally, GeneMine makes good use of that fact that it uses multiple, independent sources of information. That is, this feature allows the opportunity for cross-validation of predicted characteristics and relationships. In the expert-query paradigm, the user tries a specific query in search of a specific kind of prediction; in GeneMine, many queries are performed against very different kinds of information sources, which are then assembled on the sequence as annotations. This method is very effective at making patterns of evidence visible, because “all the data are projected onto the sequence alignment so that relevant information should be vertically aligned (to the sequence region responsible for the activity, be it an active site or entire domain) even if they come from separate sequences.” 24
GeneMine is freely available to academic researchers and the general
public. It is available for LINUX, SGI, and Solaris operating systems (see www.bioinformatics.ucla.edu/genemine for downloads or other information). The software may be used (via X-Windows) on a PC or Macintosh accessing a UNIX server. Although I have a Linux system, I was not able to download GeneMine for trial due to a solitary subscription to the AOL ISP service; it does not permit Linux connections as this time.
One may ask how precisely can genetic data mining be used in a practical manner other than for purposes of pure research, as presented above. A team of pharmaceutics and computer-science researchers at the University at Buffalo, one of very few teams in the nation applying DNA “microarray” technology in studies of multiple sclerosis (MS), has developed a method of interpreting the massive amount of information that results from such experiments. 5
The application of this method to genomic data could help researchers in the UB School of Pharmacy and Pharmaceutical Sciences, the School of Medicine and Biomedical Sciences and Buffalo General Hospital to develop and ultimately predict the best treatment strategies for MS patients based on levels of gene expression, the process by which a gene's coded information is converted into, or expressed, as proteins in cells. 5
Results of the work -- which involves using “cluster analysis to differentiate healthy controls,” MS patients and MS patients being treated with “inteferon-beta based on microarray data” -- was presented this past spring at the First Society for Industrial and Applied Mathematics Conference on Data Mining in Chicago.
According to Aidong Zhang, Ph.D., UB associate professor of computer science and engineering, and Murali Ramanathan, Ph.D., UB associate professor of pharmaceutical sciences, "MS is a complex disease and multiple genes contribute to it," In patients receiving interferon-beta, the first treatment shown to be effective in delaying symptoms in high-risk MS patients, gene expression is affected by both the disease and the treatment. Microarray technology, Ramanathan explained, “is responsible for bringing these kinds of explorations into the realm of possibility because it can measure the expression of thousands of individual genes caused by drugs or disease. Before we had this technology, we couldn't even have considered doing experiments of this magnitude. Now we can get data on thousands of genes just from a single patient blood sample. It's parallel processing in biological terms." 5
However, in any given gene expression profile that results from microarray
measurements, Ramanathan explained, the majority of the genes being scanned
do not provide useful information; the challenge lies in finding those that
do. "We need to find which of these genes change and which do not, so that we then
can determine which changes reliably are associated with disease effects
and which with treatment effects," he said.
That is a job for computer scientists, or more precisely, data-mining specialists.
"Data is of little use without intelligence," said Zhang.
The focus of Zhang's group is to look at automated detection of patterns
and to devise rules for interpreting that data, using various types of analyses,
including cluster analysis. Using a method called "maximum
entropy," Zhang and her colleagues developed a “clustering algorithm to classify the populations
in Ramanathan's study as either a healthy control, an untreated MS patient
or an MS patient being treated with interferon-beta.” They do it by converting
the numeric information generated in a gene expression profile into a feature
model that reveals a pattern that may be different or worth highlighting.
The data in those features then may be measured, revealing potentially relevant
differing levels of gene expression. 5
"It would be impossible for me to get this information without the
good work of my colleagues in computer science," said Ramanathan, who, in addition to Zhang, works with Raj Acharya, Ph.D., chair
and professor in the Department of Computer Science and Engineering affiliated
with UB's College of Arts and Sciences and School of Engineering and Applied
Sciences, who is a specialist in pattern recognition. 5
While much of the science and technology of data mining and warehousing is still in the realms of pure research (as discussed above), the health care industry also come to value and embrace the enormous potential of these technologies. The “industry” includes health-maintenance organizations (HMOs), insurance companies, pharmaceutical companies, and third-party “cottage industries” that specialize in creating various solutions to real-world issues.
There are countless ways in which carefully executed data-mining practices can benefit the health care industry. Two of the most obvious potentials gained from carefully mined rules are saving and/or improving the quality of life and cost savings for the industry.
Between 1993 and 1994, 12 percent of patients who were suffering from pneumonia died at Norfolk, Va.-based HMO Sentara Health System. Although lower than the national average of about 14 percent, the number still seemed too high to Sentara's doctors. What's more, a good many other pneumonia sufferers developed complications requiring expensive antibiotics and an average stay of two weeks, as opposed to the optimal three- to five-day stay of appropriately treated pneumonia patients without complications, says Robert D. Brickman, Sentara's medical director of clinical effectiveness. 6
The doctors at Sentara always knew something was wrong. When they
ordered sputum cultures for pneumonia patients, they wouldn't hear back from
the lab for several days -- if at all. Without lab results, they could only
guess what was wrong and how best to treat it; meanwhile, patients got sicker
as they waited for results. Yet it wasn't until Sentara's quality improvement
team began an exploratory mining foray into claims data in its Oracle-based
data mart that the doctors' suspicions were confirmed. Besides uncovering
the high pneumonia mortality and complication rates, the team noticed that
doctors were ordering sputum cultures many times for the same patient; upon
inspection, they learned that the doctors did so in hopes that at least one
test would yield useful, timely information. The quality team quickly devised
a new system of transferring the culture from the patient to the lab, and
the lab results back to the doctor within two hours. Not only did the mortality rate for pneumonia patients fall to 9 percent,
but their average stay dropped to one week and the cost of managing a single
pneumonia case decreased by $2,000. "Attack the quality of health care, and amazingly the costs come down as well," says Bert Reese, Sentara's corporate director for information systems.
The process that led Sentara to improve the quality and efficiency of care
for its pneumonia patients is known in the health-care industry as "outcomes measurement." A form of data mining, outcomes measurement involves examining clinical encounter
information, insurance claims and billing data to measure the results of
past treatments and processes. By understanding what worked -- or didn't
-- providers can identify areas for improvement or capitalize on successful
methods.
"The business of practicing medicine is so complex that it pushes
the sophistication of data mining tools," says Brad L. Armstrong, global managing director of Deloitte and Touche Consulting Group's Health Systems Integration practice in Los Angeles. "There are thousands of services, relationships built over time, and multiple
diagnoses and interactions. That complexity will continue to push progressive
data mining applications that will rival those in banking or retail."
Applications of data mining in the health-care industry are widespread.
One way data mining is helping health-care providers cut costs and improve
care is by showing which treatments statistically have been most effective.
For example, once hospital administrators recognize that stroke patients
are less likely to develop respiratory infections if they can swallow properly,
they can educate their physicians and institute a standard policy to identify
and provide therapy to those who have difficulty swallowing. Outcomes measurement
also helps HMOs evaluate their doctors and facilities. Physicians and hospitals
benefit from knowing how they compare with their peers, and the parent company
saves money by getting all of its employees up to par. (Incompetent doctors
are an expensive liability because high-quality preventive care is much more
cost-effective than correcting a mistake later in the emergency room.) Along
the same lines, outcomes measurement also lets caregivers identify people statistically at risk for certain ailments so that
they can be treated before the condition escalates into something expensive
and potentially fatal. Fraud detection is yet another outcomes analysis application:
When administrators compare the volume of lab tests ordered by physicians,
evidence that a doctor is ordering too many unnecessary tests would leap
off the page. Finally, providers are using data mining to cross-sell and
market new products and services. An allergy sufferer who has tried a variety
of treatments without success, for instance, might be receptive to alternative
herbal or acupuncture treatments.
"Information has become the most valuable commodity in health care," says
Jeffrey C. Bauer, president of Hillrose, Colo.-based consultancy The Bauer Group
Inc. "In the past, studies have shown that as many as one-third of all medical interventions
do not lead to an improvement in patients' conditions. In other words, about
33 cents on the dollar is spent on services that do not demonstrably make the
patient better off. But today we can afford to provide only productive interventions.
Outcomes data will finally allow us to weed out the resources that aren't making
people better."
In the case of Sentara, outcomes analysis is helping decrease variability
of treatment among its five hospitals, 180 doctors, nine nursing homes, nine
urgent care centers and nine Navy outpatient clinics. "The way you eliminate error is to homogenize and standardize so [that things
are] done the same way every time, on time," explains Brickman. A team of hospital administrators and doctors scours Sentara's
data mart with Orlando, Fla.-based MedAI Inc.'s decision-support software,
looking for the most effective and least expensive treatments. Their recommendations
are passed on to the rest of the staff. "If we can reduce variation around the best practice, we can improve quality of
care and the outcomes," says Reese. 6
Data warehousing can be applied to just about any are of the health care industry. Rather than going through the entire list of applications, we can choose one of potential candidate: the pharmaceutical industry.
Anyone who works for a pharmaceutical company will tell you without hesitation, "Sales and marketing within the pharmaceutical industry is unlike sales and marketing in any other industry." The big secret is that a sales representative of a pharmaceutical manufacturer does not actually sell anything. Within other industries that have a more traditional sales model, a sales representative knows immediately after a sales call whether or not a sale was made. The potential customer either places an order or sends the sales representative away without a sale. This traditional model does not exist within the pharmaceutical industry. Instead, it is the responsibility of the sales representative to provide information by discussing product characteristics and benefits to the physicians and potential prescribers. The goal of the sales representative is to influence prescribing habits, so that when a patient comes into the office with symptoms X, Y and Z, it's their drug that is prescribed. This indirectly results in the sale of products at the pharmacy.
In the pharmaceutical manufacturing industry, information is critical to the success of the sales presentation process, which requires a detailed knowledge of the product. Certainly a product database with product specifications, clinical trial and patient outcome results could be an invaluable tool to the sales representative. However, this detailed product information is only one dimension of information that a sales representative requires to be effective. Pharmaceutical sales representatives and managers look for information that can provide insight into the management of the sales process. They need to know current business conditions (measures of the business or facts); internal measurements (measured ratios comparing results to internal factors); external measurements (measured ratios comparing results to external factors); and why changes have occurred.
In order to provide this information to support managers and sales representatives, it is necessary to collect data about the sales process, put it in one place and build reports against it. In an environment where we understand the business need and analytic requirements, we can see that a data warehouse could provide end users with a single place to go in order to get the answers to their many questions. Providing end users with transparent and timely access to information will improve the productivity of the organization and provide management with a competitive advantage. The automation of the reporting process will provide the analysts with the opportunity to actually perform analysis rather than spend time building reports.
The building of a data warehouse in the pharmaceutical industry is similar to the process that would be followed in other industries; however, there are certain key factors which need to be considered during the development cycle:
This industry has a tremendous dependency on third-party data. Companies such as IMS America Inc. and Walsh America/PMSI actually gather information directly from the pharmacies, doctors, hospitals and managed care plans about patient care and prescriptions and resell this information to pharmaceutical companies. Since most of the inventory manufactured is sold directly to large wholesalers, without this third-party information, pharmaceutical companies would have very little information on the sale of their products. 34
Timing of the various data sources also has a significant impact on the reporting process. Some of the external data sources aren't available until months after the transactions occur which needs to be taken into consideration when constructing the time dimension and in building management reports.
External data needs to be integrated within the data warehouse and typically needs to be scrubbed to cross-match this data with internally maintained data about customers and products. Data cleansing is a critical component of the data warehouse for a pharmaceutical company and usually requires the implementation of software designed for this function.
The user community has a much larger geographical dispersion than in most industries, with the majority of the users being mobile field representatives. This complicates the process of delivering information to these users significantly due to the remote nature of their network access.
There are certain regulatory reporting requirements that can be satisfied through careful design of the data warehouse.
The pharmaceutical industry has one of the most dynamic and volatile environments in business. With the threat of legislation and constant "improvements" to the health care industry, the sales process and, therefore, the data are in a constant state of flux. The most critical lesson that can be learned from the pharmaceutical data warehouse model is the need for flexibility and quick implementation. By the time a multi-year project is implemented, the industry could have transformed into something completely different. The data warehouse should also be constructed with adequate flexibility so that when a new twist gets thrust upon the industry, the data warehouse can be modified to handle these changes instead of having to be rebuilt from scratch.
The process of building a pharmaceutical manufacturing data warehouse is a complex and iterative process that is clarified only by understanding the uniqueness of the industry. As in other industries, a successful data warehouse is based upon the business need of the end users that require access to information in order to increase their effectiveness and productivity. Although a painful process at times, the benefit of a carefully constructed data warehouse has proven itself to be well worth the investment. 34
There are plenty of third-party companies (vendors) that stand ready
to help health-care providers mine their data. But this can be a mixed bag
of pros and cons. For one, getting buy-in from the end user can a thorny
area for IT executives implementing a data mining project. Convincing users
in marketing, HR or out in the field (be it branch office employees or doctors
in a hospital) to surrender peacefully their standard modes of operation
for a new technology is never easy. Doctors might be even less tolerant to
forced change than most users since they're accustomed to a high degree of
professional autonomy. "The doctors were nervous at first about being compared because they saw their
reputations at stake," says Brickman about Sentara's data mining efforts. "They believe they graduated from medical school and should be allowed to make
their own decisions." 6
One way to foster user acceptance is to keep the data model as simple and
easy to understand as possible. End users -- doctors included -- will never
agree to change their procedures if they don't understand how the system
works. "If I make the model very complex and intricate, how do I expect a novice with
no IS background to do a query?" asks Reed. 6
But the surest way to circumvent end-user resistance in this and all other
major IT initiatives is to include users from the beginning and listen to
their feedback. Reese's strategy of proving the concept with a real-life
example also can't hurt. After seeing the value of data mining for pneumonia
patients, the Sentara doctors embraced the concept. "This is not about good and bad doctors, it's about good and bad processes," says Reese. "The premise is that physicians want to help patients. If you can convince the
doctors that something's good for the patients, then you're OK." 6 And, as it turns out, so are the patients. In time, data mining could render
obsolete numbers like the 12 percent pneumonia mortality rate at Sentara.
An example of a third party vendor is Symmetry Health Data Systems, Inc. This company provides sophisticated data-decision support tools and software to the managed care industry. “Recognizing the complex nature of the provision of medical care services, Symmetry designs and creates its analytic products by uniquely organizing data to define and clarify for maximum insight. The result is a transformation of data to actionable information which is logically understood by clinicians as well as administrators.” 8
Symmetry has extensive experience in healthcare data analysis including the initial development of many of the techniques and software platforms which are today's industry standards. They have a patent for their Episode Treatment GroupsTM (ETG) software, a proprietary method of identifying an episode of care and a universal analytical unit for the managed health care industry. The ready-to-run applications provided with the software allow one to configure the ETG Grouper and group your data using a plain text file of claims as input. There are no associated reports. Report development must be provided by the user or the health care information vendors which have adopted ETGs as their reference standard. The health care provider controls the amount and format of the claims data as input, providing provider profiling, utilization management, clinical benchmarking, disease management and capitation and predictive modeling possibilities. The ETG software is distributed on CD-ROM for all platforms except the IBM mainframe, which is delivered on a 3480/3490 tape cartridge. Installation instructions are printed on the media package. The software includes ready-to-run applications for configuring and running the ETG Grouper. For more detailed information on ETG, refer to this URL http://www.symmetry-health.com/ETGTut_Desc1.htm. 8
Any time an organization deals with consumer data, privacy and security
become paramount. That is especially true in the health-care industry where
the data in question -- medical records -- is highly sensitive. To protect
themselves and their patients, some health-care organizations have developed
exemplary security strategies, says Jeffrey C. Bauer of the Bauer Grop. "The fact that there is no national scandal, no outraged patients, shows that
the health-care industry is doing something right that the government and
banks can learn from," he says. Aside from building firewalls and encrypting data, some health-care
providers safeguard patient data by limiting who has access to it. Sentara,
for instance, includes patient identifiers in its data warehouse, but lets
only a team of about six doctors and administrators look at the data. If
other doctors have a query, they must submit it to the quality improvement
team. "The doctors can't access the information, because it has to be confidential," says Brickman. "Every plaintiff's attorney would love to get his hands on this detailed information
[for malpractice suits]. It can be protected from discovery only if it's
kept private."
Intermountain Health Care, an integrated health-care system in Salt
Lake City, sidesteps the security issue altogether by stripping its databases
of any patient identifiers. Only an account number is used to link elements
of a patient's
record, stored in six Oracle data marts. Leaving the data anonymous ensures
that any of Intermountain's 20,000 or so employees can access its riches
through the company's intranet, says Data Warehousing Project Leader Ping
Wang. Doctors mine Intermountain's Oracle database themselves using Netscape
or Microsoft Explorer browsers to answer what-if questions and determine
the most appropriate treatments.
In today's world of electronic patient records and large networks of health care providers, vast databases of patient information can be easily assembled and studied. The increased availability of such information raises numerous concerns with respect to patient privacy. Many of these concerns relate to the danger of unauthorized access from outsiders, such as reporters or computer hackers. Fortunately, a number of security devices are available to limit these types of risks.
However, other concerns have been raised in connection with how these databases are used by those inside or affiliated with the health care network. In this context, the sacrifices to patient privacy must be measured in light of the benefits of accessing and studying the available data. In many instances, patients--and the public in general--will be better off if responsible use of patient data is permitted.
Patients can benefit in many ways from the increased accessibility of their medical information, whether that data is "individually identifiable" or not. "Individually identifiable health information" has been defined as information that identifies a patient or with respect to which there is a "reasonable basis to believe that the information can be used to identify the patient." Some examples of individually identifiable information include records containing the patient's name, social security number or photograph. Although this type of data is often more useful for data mining purposes, it is also much more sensitive and thus subject to greater limits on use.
The following are some examples of how patients may benefit from increased accessibility to their individually identifiable medical records:
The following are some examples of how aggregate data can be used:
Although there are numerous benefits tied to mining medical data, it does present some additional risks, especially to patient privacy. This risk varies, depending on the type of information used and analyses being performed. Notably, privacy concerns are more pronounced where individually identifiable information is involved. Accordingly, it makes sense to place some legal restrictions on how patient data may be mined. However, these restrictions should not be allowed to eclipse the many advantageous uses of patient databases. Legislators must recognize that a little loss of privacy, when weighed against the significant benefits of data mining, may prove to be very healthy for patients and the public in general.
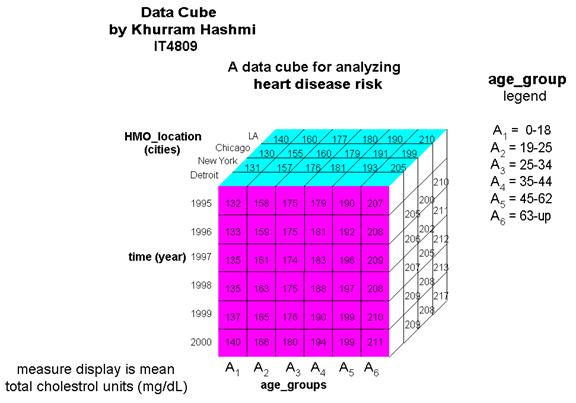
I constructed the data cube in the illustration above as a demonstration of how an organization – such as a consulting group for HMO’s and health insurance companies – can use OLAP operations with a multi-dimensional model. The cube above, a 3-D data cube, represents an analytical approach for analyzing heart disease risk based on data in the organizations model.
A high total-serum cholesterol level is the single leading cause of coronary heart disease (CHD); during routine blood tests, total cholesterol is often measured. Values above 200 mg/dL is considered a risk factor for CHD. Total cholesterol increases with age, as can be seen in the cube. The total cholesterol levels for Americans is the highest in the world, and has been increasing at an alarming pace in the 1990s due to the amount of “junk” food in the diet, also noted in the cube. The dimensions of this cube show HMO locations grouped in terms of various US cities and the mean (average) total cholesterol levels of its members…and how the levels have changed (or, better yet, controlled) in the past five years. Information like this can gauge the quality of medical care patients are receiving, such as in the proper prescription of cholesterol-lowering drugs. The cube above is by no means limited to the dimension types shown. A star schema for a heart_disease_risk data warehouse may be constructed in a manner such that each dimension has several levels of hierarchical attributes.
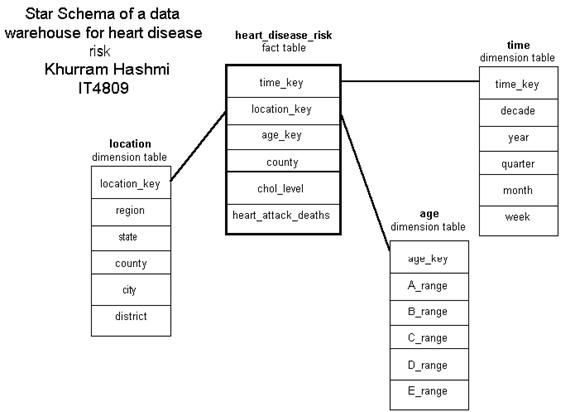
The star schema illustrated above may be defined in DMQL as follows:
define cube heart_disease_risk [location, time, age]:
chol_level = avg(mg_dL), heart_attack_deaths = count(*)
define dimension location as (location_key, region, state, county, city, district)
define dimension time as (time_key, decade, year, quarter, month, week)
define dimension age as (age_key, A_range, B_range, C_range, D_range, E_range)
Note: the age range units are in hierarchical order: e.g., A_range (0-18); B_range (0-15), (16-20), etc.; C_range (0-12), (13-16), (17-22), etc; and ever-narrowing ranges for D_range and E_range.
Having defined the schema with dimensions containing various hierarchical levels of attributes, one can easily perform OLAP operations such as roll-ups and drill-downs. For example, drilling down on the location dimension can give us a clearer picture of how effectively HMOs (or hospitals) are dealing with CHD with respect to different districts within a city. Rolling up on the same dimension can give us an indication on how particular HMOs are doing within a state, or region (Midwest, West coast, South, etc.).
Given the information in a medical data warehouse, what type of data mining tasks can be performed on it for fruitful knowledge discovery? “A data mining task can be specified in the form of a data mining query, which is input to the data mining system.”1 A data-mining query is defined in terms of the following primitives:
Task-Relevant Data: The portion of the database or data warehouse to be investigated. So, for the heart_disease_risk data warehouse above, if the HMO consultant group is only interested in studying the association between CHD and patients in New York, the task-relevant data can be specified with the following information:
Kind of Knowledge to be Mined: This specifies the data mining functions to be conducted, such as association, classification, clustering, etc.
Association analysis is certainly a very popular function. Using the data in the data cube, we may be able to mine association rules such as the following:
age(X, “A1”) ^ location(X, “Detroit”) → not_have(X, “heart attack”) [0.8%, 90%]
This indicates that persons aged 0 – 18, who live in Detroit are not likely (with 90% confidence) to have cholesterol-related heart attack (and such persons represent 0.8% (support) of total patients). This goes with common sense in that children have very low cholesterol to begin with and represent only a very small minority of patients.
age(X, “A1”) ^ time(X, “1999”) ^ location(X, “New York”)→ not_have(X, “heart attack”) [0.3%, 95%]
Similar to above, but because the rule is much more specific, and given the same young age group, the support is lower and the confidence is higher.
Background Knowledge: Concept Hierarchies: Background knowledge is information about the domain to be mined that can be useful in the discovery process. Concept hierarchies define sequence of mappings from low level concepts to higher-level, more general concepts. This is illustrated in the above schema and data cube. For example, the in the dimension time, at its highest level attribute is decade. Drilling down will, respectively, give us lower-level concepts such as year, quarter, month and week.
Set-group hierarchies for the above cube and schema were defined in the age or age_groups dimension. Specifically,
{A1, A2, A3, etc.} ⊂ all(age)
{0…18} ⊂ A1
{19…25} ⊂ A2
etc.
Based on the primitives above, we can develop specific queries based on “standard” DMQL syntax. 1
Example of a query based on [ Mine_Knowledge_Specification ] statements:
Characterization:
mine characteristics as HavingHealthyCholesterol
analyze count%
This example specifies that the kind of knowledge to be mined is a characteristic description describing patients having a healthy cholesterol level.
Association:
mine associations as not_having_CHD
matching age(X, “A1”) ^ location(X, “Detroit”) → not_have(X, “heart attack”)
This example is based on the primitive given earlier; now it’s more clearly defined in terms of DMQL. Specifically, we are looking for patterns of associations using the matching clause to dig up metarules or metapatterns. In this case, we are looking to establish specific patterns.
Printed Material:
1. Data Mining: Concepts and Techniques. Han, Jiawei and Micheline Kamber. 2001. Academic Press / Harcourt / Morgan Kaufmann Publishers. San Diego. ISBN 1-55860-489-8.
2. Fundamentals of Database Systems Third Edition. Elmarsi and Navathe. 2000. Addison-Wesley. Reading, Massachusetts. ISBN 0-8053-1755-4.
Web and Internet:
3. http://www.cs.uml.edu/~phoffman/dna1/
4. http://www.anvilinformatics.com/portfolio/dna/dna.html
5. http://www.globaltechnoscan.com/25thApr-2ndMay01/microarray.htm
6. http://www.cio.com/archive/061597_mining_content.html
7. http://www.pcc.qub.ac.uk/tec/courses/datamining/stu_notes/dm_book_1.html
8. http://www.symmetry-health.com/
9. http://research.cmis.csiro.au/gjw/dataminer/health.html
10. http://www.cs.ubc.ca/nest/dbsl/mining.html
11. http://magix.fri.uni-lj.si/idadm/
14. http://industry.ebi.ac.uk/~brazma/dm.html
15. http://www.nature.com/genomics/human/papers/analysis.html
16 http://www.ensembl.org/genome/central/
17. Tools for DM (NCBI): http://www.ncbi.nlm.nih.gov/Tools/
18. NCBI (site map) http://www.ncbi.nlm.nih.gov/Sitemap/index.html
20. European Bioinformatics Institute: http://www.ebi.ac.uk/
21. GeneCards: http://bioinformatics.weizmann.ac.il/cards/knowledge.html
22. http://bioinfo.weizmann.ac.il/c.ards/index.html
23. IBM GeneMine: http://www.research.ibm.com/journal/sj/402/lee.html
24. GeneMine (main): http://www.bioinformatics.ucla.edu/genemine/
25. GeneWise: http://www.cgen.com/products/genewise.htm
26. IBM/Oracle Data Warehouse Prescription Drug: http://www-1.ibm.com/servers/eserver/xseries/numa/solutions/success/kaiser.html
27. IBM/Mental Health DW: http://houns54.clearlake.ibm.com/solutions/healthcare/helpub.nsf/detailcontacts/Data_Warehouse_Helps_Texas_Innovate_Mental_Health_Managed_Care
28. http://www.dba-oracle.com/dw_proj.htm
29. http://www.ingenix.com/index.html
30. http://www.kpchr.org/info/data4.html
31. http://www.informationweek.com/596/96pharm.htm
32. Univ of Wisconsin Family Medicine DW: http://www.fammed.wisc.edu/administration/clinical/demo/warehouse/overview.html
33. State of Nevada Health DW: http://health2k.state.nv.us/matchiim/center.htm
34. Data Warehousing in the Health Care Industry - Three Perspectives: http://www.dmreview.com/master.cfm?NavID=198&EdID=696
35 COGNOS in clinical use: http://www.ergopartners.com/ErgoWeb1V4_4.htm
36. http://www.sqlmag.com/Articles/Print.cfm?ArticleID=7833
37. http://www.datawarehousingonline.com/
37. MITOMAP: http://www.gen.emory.edu/mitomap.html
39. MEDWEBPLUS: http://www.medwebplus.com/about
40 SPSS: http://www.spss.com/
41. Clementine: http://www.spss.com/clementine/
Fig.1 BLAST browser-based data mining tool at NCBI
RPS-BLAST 2.2.1 [Apr-13-2001]
Query= gi|532319|pir|TVFV2E|TVFV2E envelope protein
(379 letters)
![]()
![]()
PSSMs producing significant alignments:
Score
(bits)
E
value
GP120, Envelope glycoprotein GP120. The entry of HIV requires ...
5e-98
GP41, Envelope Polyprotein GP41. The gp41 subunit of the envel...
4e-14
gnl|Pfam|pfam00516, GP120, Envelope glycoprotein GP120. The entry of HIV requires interaction of viral GP120 with CD4 and a chemokine receptor on the cell surface.
CD-Length = 490 residues, only 60.4% aligned
Score = 351 bits (900), Expect = 5e-98
Query: 2 LRLRYCAPAGFALLKCNDADYDGFKTNCSNVSVVHCTNLMNTTVTTGLLLNGSYSENRTQ 61
Sbjct: 195 IPIRYCAPAGFAILKCNDKKYNGFGPNCSNVSTVQCTHGIETVVSTQLLLNGSLAEERTY 254
Query: 62 IWQKHRTSNDSALILLNKHYNLTVTCKRPGNKTVLPVTIMAGLVFHS--QKYNLRLRQAW 119
Sbjct: 255 IRSENFT-DNRKIIIVNLNYNLTINCKRPGNKTVLPITSMGGLVFHSTGQIIN-RLRQAW 312
Query: 120 CHFPSNWKGAWKEVKEEIVNLPKERYRGTNDPKRIFFQRQWGDPETANLWFNCHGEFFYC 179
Sbjct: 313 CNFKGNWNEALKEVKKKLRKLPRYKGQTTKNITFT-SSSTGGDPEITMHWFNCRGEFFYC 371
Query: 180 KMDWFLNYLNNLTVDADHNECKNTSGTKSGNKRAPGPCVQRTYVACHIRSVIIWLETISK 239
Sbjct: 372 NMTWFFNWVNN---------------------RNNNKTGQRIYLPCRIRQIINMWQKVGK 410
Query: 240 KTYAPPREGHLECTSTVTGMTVELNYIPKNR--TNVTLSPQIESIWAAELDRYKLVEITP 297
Sbjct: 411 AMYAPPREGHITCNSNVTGLLLTIDGGNNNNNETNRPGSGEMRDNWRSELGKYKLVEITP 470
Query: 298 IGFAPTEVRRYTGGHERQKR 317
Sbjct: 471 IGFAPTKVKRYTVAPHREKR 490
gnl|Pfam|pfam00517, GP41, Envelope Polyprotein GP41. The gp41 subunit of the envelope protein complex from human and simian immunodeficiency viruses (HIV and SIV) mediates membrane fusion during viral entry.
CD-Length = 336 residues, only 10.7% aligned
Score = 72.4 bits (176), Expect = 4e-14
Query: 344 VQSQHLLAGILQQQKNLLAAVEAQQQMLKLTIWGVK 379
Sbjct: 21 VQSRTLLAGIVQQQQNLLDAVEAQQELLRLTVWGVK 56
Fig. 3 FASTA33 at EMBL/EBI
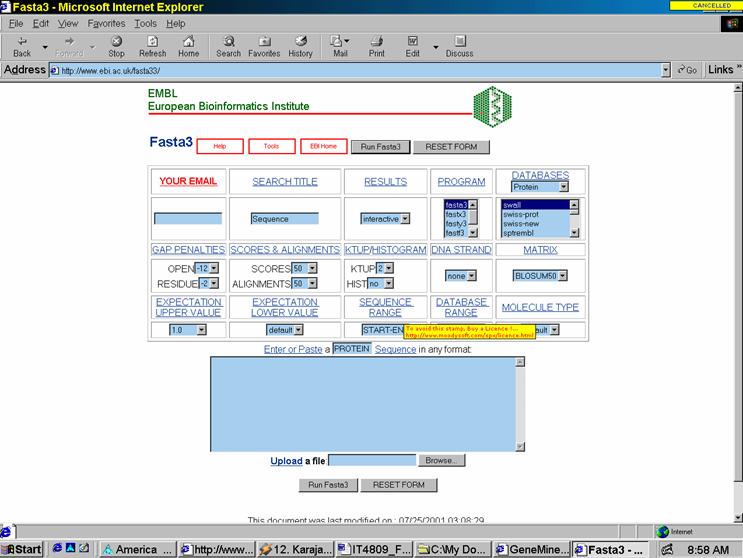
Fig. 4: GeneMine main window
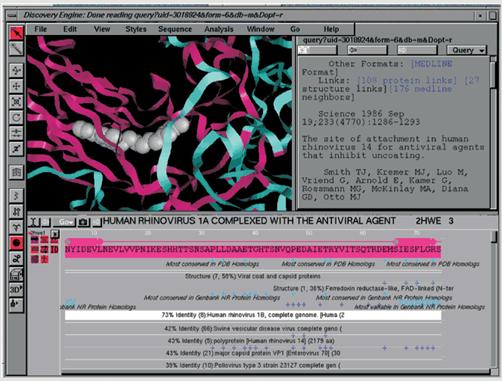
Fig. 5: GeneMine
top of page | More Data warehousing and data mining information: OLAP vs. OLTP | Multiple Dimensional View of Database: ROLAP, MOLAP, HOLAP | Data Warehouse Project Warnings | Data Mining Primitives, Hierarchies, Architecture and Coupling | Data Preprocessing for Data Warehouses | Dimensions of data quality, tuples with missing values, data smoothing and data integration | Data Warehouse Project vs Any Other Large Database Implementation
Back to Info-Source home page | Other Information Technology pages: Project Management Software | Project Management Training — FAQ part 1 | FAQ part 4: Cost-Time Graph and Shortening Critical Path